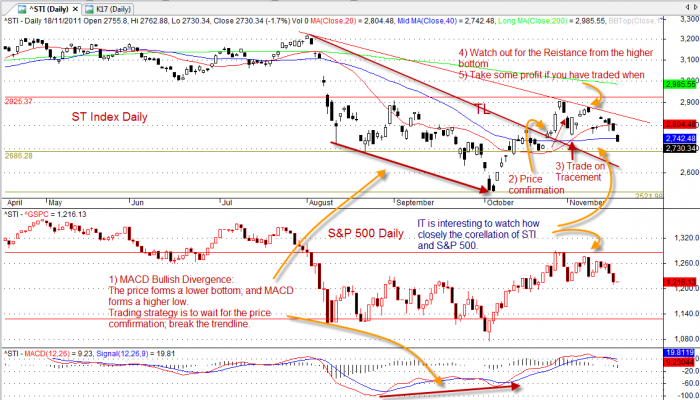
STI has been down for the last 5 days since Monday, November 14? (In short term,) will STI stop falling? The market can only do one of the three things; up, down or sideways.
While the STI is bearish, are there any buying signals? There are ways to identify the trades, MACD scan is just one of them. See the post for the scan for Singapore Stocks Market closed November 18, 2011.
The Analysis:
The index has closed below the 200 days low. If it does not stop and reverse, the next level to hold the fall will be around the zone 2686 level. So, monitor the market in the next few days for the index action.
Correlation:
It seems there are some correlation of STI (ie ST Index, Straits Times Index) and S&P 500 (ie SP 500) so far. See the chart that follows.
Disclaimer
The above result is for illustration purpose. It is not meant to be used for buy or sell decision. We do not recommend any particular stocks. If particular stocks or indices of such are mentioned, they are meant as demonstration of Amibroker as a powerful charting software. Example, it can insert another price or index such as S&P 500.
Once again, the website does not guarantee any results or investment return based on the information and instruction you have read here. Please get your advice from the professional financial consultant.

