July 16, 2017
Trading Has Never Be Easy, It Is Hard Work and Struggle
Trading has never an easy task, not like many of the outsider think. Just buy low and sell high lah! It is a hard work and a struggle. There are many fade breakout, and to identifying the forces and the markets direction so you can ride the waves with these big players even more hard.
See China Stock for Some Experience
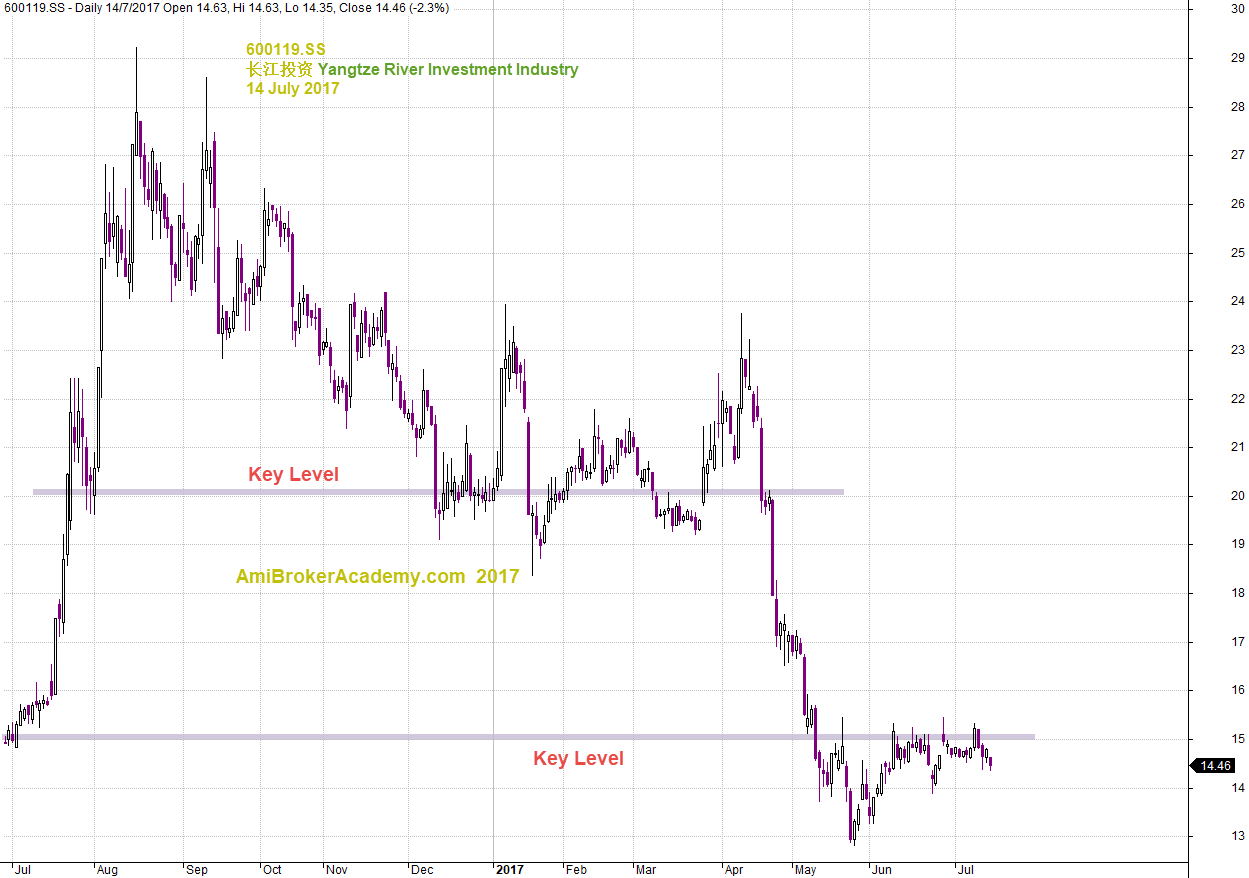
600119.SS Yangtze River Investment Industry Share Price and Key Levels
Picture worth a thousand words. See chart for more information.
The stock price has been drifting south after a rally in July, August last year. If we break the support resistance level into to groups. You can easily identify that the first support can not hold the fall. Although the share price was struggle to bounce back up.
The second group of support resistance, has fail to hold the price too. See share price breakout lower in May and got resisted.
Can the stock price break the resistance and move north again? Will see.

July 14, 2017 Yangtze River Investment Industry and Key Levels
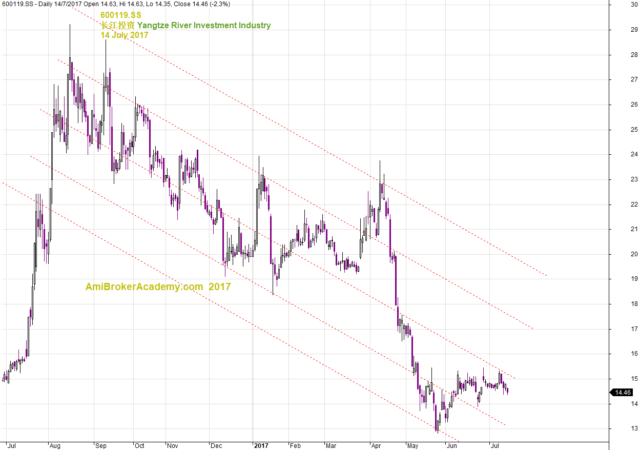
600119.SS Share Price and Channel
Picture worth a thousand words. See chart for more on trend, slopping down from top left to bottom right. Bearish.
Stock price has broken lower on the previous channel, and stay even more low the two months.

July 14, 2017 Yangtze River Investment Industry 600119.SS and Channel
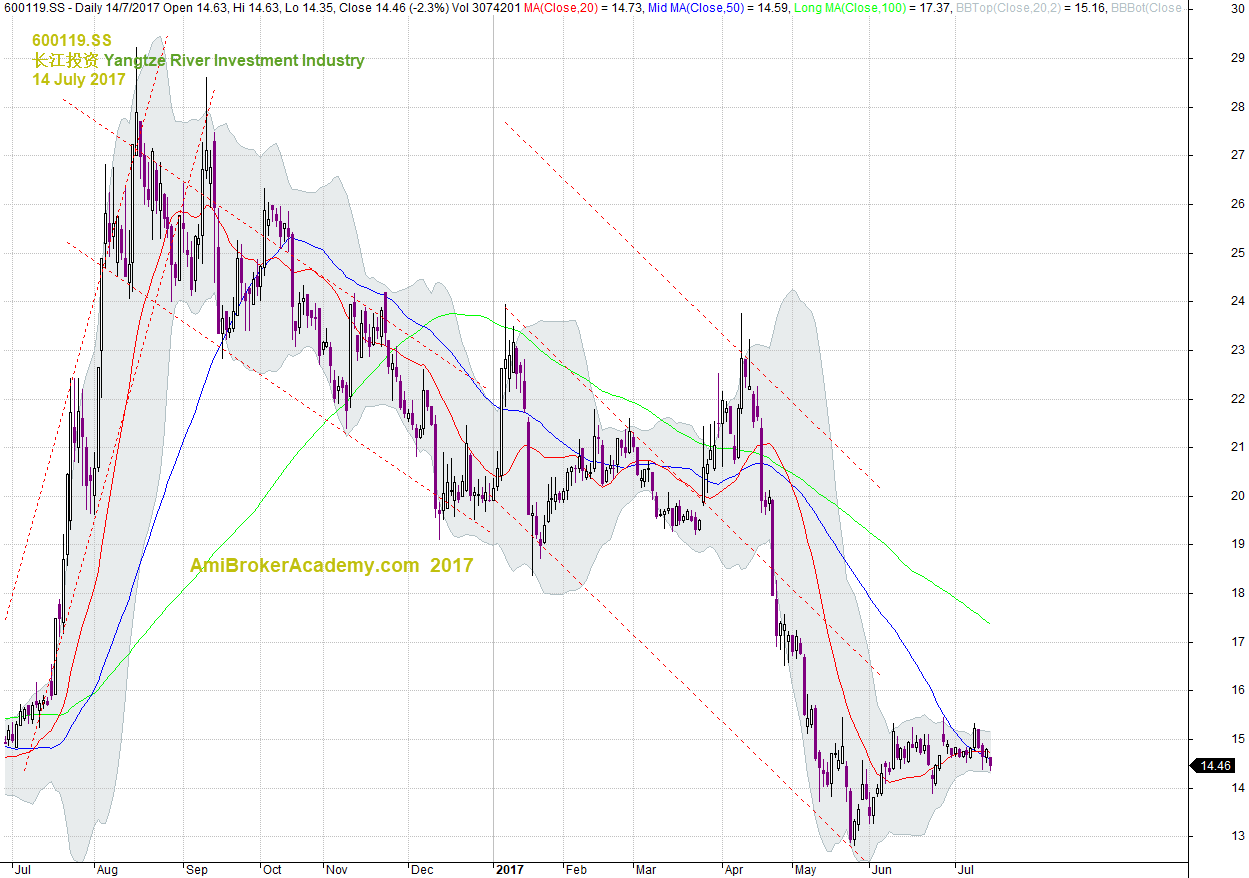
长江投资 600119.SS Yangtze River Investment Industry and Six Months Channel
See chart for more, the following channels is slightly different from other analysts. Instead of just connecting the high or low, we connect the high or low of every six months. We like to see how the share price behave in every six months.
Have fun!

July 14, 2017 Yangtze River Investment Industry and Channels in Six Months
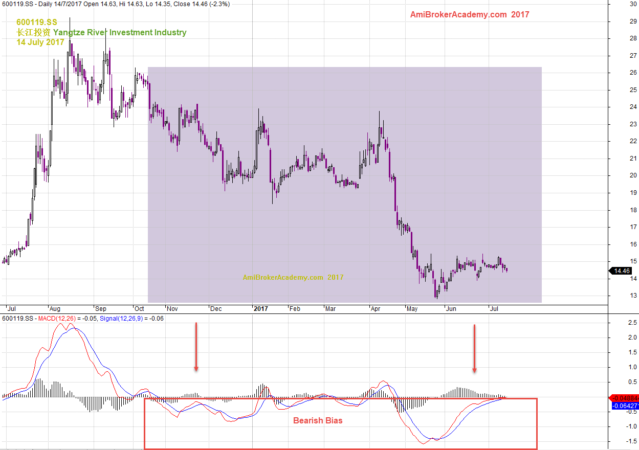
600119.SS 长江投资 Yangtze River Investment Industry and MACD
We colour the chart to correspond with the MACD bearish bias signal. If you will listen to the MACD indicator, you may not buy and now not sure what to do, continue to hold or sell and cut lost.
Enjoy learning.
Remember MACD is a leading trend direction indicator.

July 14, 2017 Yangtze River Investment Industry 600119.SS and MACD Signals
Moses
AmiBrokerAcademy.com
Disclaimer
The above result is for illustration purpose. It is not meant to be used for buy or sell decision. We do not recommend any particular stocks. If particular stocks of such are mentioned, they are meant as demonstration of Amibroker as a powerful charting software and MACD. Amibroker can program to scan the stocks for buy and sell signals.
These are script generated signals. Not all scan results are shown here. The MACD signal should use with price action. Users must understand what MACD and price action are all about before using them. If necessary you should attend a course to learn more on Technical Analysis (TA) and Moving Average Convergence Divergence, MACD.
Once again, the website does not guarantee any results or investment return based on the information and instruction you have read here. It should be used as learning aids only and if you decide to trade real money, all trading decision should be your own.
