Welcome to AmiBrokerAcademy.com.
Anyone can look at a chart and make a trading plan, look left and think right. When you look at the chart, as trader you should always ask, “what has took place today?” The information provides can be significant enough to reduce risk and increase rewards of your plan and strategy. Pay attention to open, close, high and low of the price on any timeframe. Each tell a story.
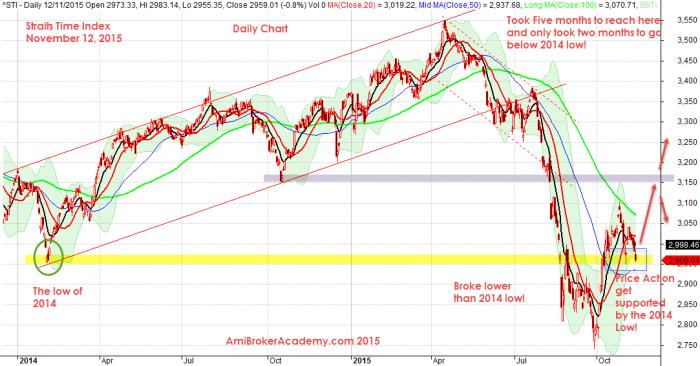
Straits Times Index Daily Chart
November 12, 2015 daily chart shows the price action has test and retest the support that was the 2014 low a few times. In fact, ^STI took five (5) months to hit the peak, but took two months to go lower than the 2014 low.
Can the price action test the high low of 2014 as chart, the point that touch the ED? Will the level resist the price action? Will see.
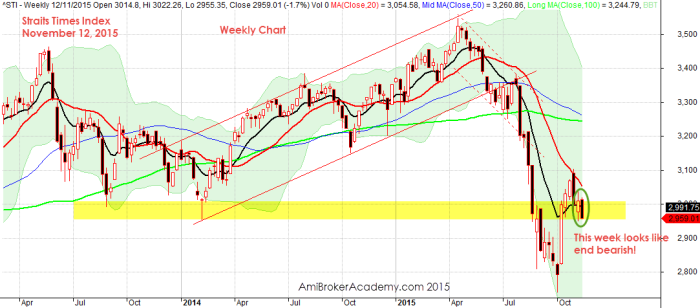
Straits Times Index Weekly Chart
The week may end bearish, closed lower than last week open. So, what does this mean to you?
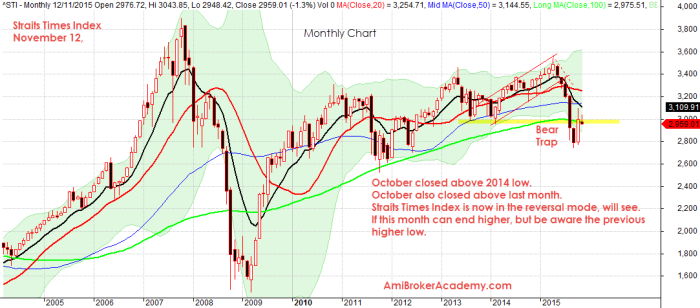
Straits Times Index Monthly Chart
October month closed above 2014 low. October month also closed above previous month.
Is Straits Times Index is now in the reversal mode? will see. If this month can end higher, but be aware the previous higher low.
Thanks for visiting the website. You can read about other stock scan and analysis here. Hope these analysis can value add your trading strategy.
Moses Stocks Scan
Disclaimer: All information, data and material contained, presented, or provided on amibrokeracademy.com is for educational purposes only. It is not to be construed or intended as providing trading or legal advice. Decisions you make about your trading or investment are important to you and your family, therefore should be made in consultation with a competent financial advisor or professional. We are not financial advisor and do not claim to be. Any views expressed here-in are not necessarily those held by amibrokeracademy.com. You are responsible for your trade decision and wealth being.


