February 14, 2018
Slow But Sure
February is always a fun and memorable month for many people, today is Valentines Day. To many of young or old couples these is a very important day for them. To traders, especially for many of them either they are happy because they sell off in time, turn paper into cash. Or they are very angry because their can not sell off in time and all the paper money become vanish.
Are you a slow but sure trader or a jumping around trader?
Buy or Sell
So, what is your plan this week? Buy or Sell. To some traders either make money, and to some both lost money.
We are taking stock of the recent US market movement. We read the chart from different perspective. However, some of the tools is always correct, such as ABCD, MACD, MA and Support Resistance. Fibonacci levels are always an interesting way to see the market reaction.
We Lost to the Robot Again
Recently, read many of the feedback and comment. We lost to the robot in Go game. We lost to the robot in finance market trading. Do you find any dent to any of the Robot, sure No. Any lost are not their money it is all yours. Either way, Robot win and you lost. That is my perspective.
Let’s continue to study some of key indexes, such as NASDAQ composite and so on.
US Stock Analysis
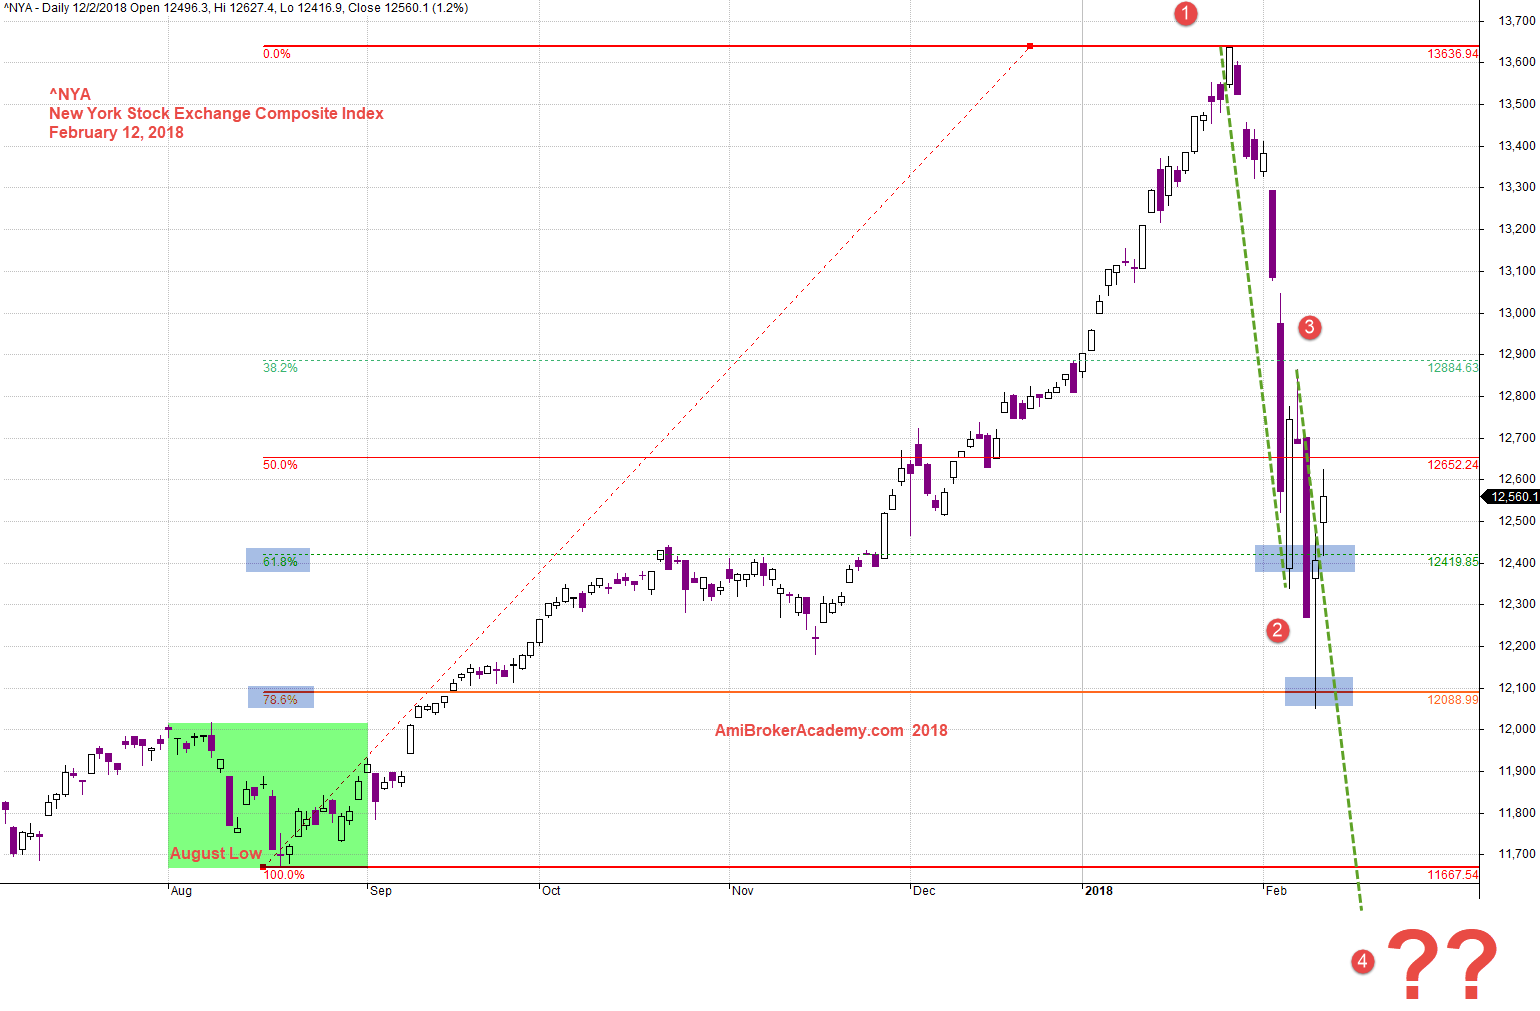
^NYA New York Stock Exchange Index and Key Fibonacci Retracement Level
Take a Fibonacci swing low from August month low, you will find the price action has completed a perfect 61.8% retracement and retest again this time breakout below and test 78.6%. The only bonus wss the price action close above 61.8%. So, bullish or bearish? Do you know? I don’t. I will suggest you monitor the price action for the next couple of days to see how the market react to these level.
Do you think the Robot know? There will search through the entire database to find the historical trade in the same manner. And big bang give it either a big buy or sell.
Robot Trade with No Fear
Win not their money! Lost also not their money! “Robot trade with no fear”. Some of these may ended up future Robot trading advertisement phrases. Have fun!
Take note on the possible ABCD pattern, watch the development of the CD leg. Anyone program the ABCD pattern to the Robot or which Robot?
Manage your risk!
Powerful Chart Software – AmiBroker
The following chart is produced using AmiBroker charting software. It is a powerful chart software. You plot the stocks you are interested all in one chart, as long as you still could read them. See chart below.

February 12, 2018 New York Stock Exchange Index and Key Fibonacci Retracement
Moses
AmiBrokerAcademy.com
Disclaimer
The above result is for illustration purpose. It is not meant to be used for buy or sell decision. We do not recommend any particular stocks. If particular stocks of such are mentioned, they are meant as demonstration of Amibroker as a powerful charting software and MACD. Amibroker can program to scan the stocks for buy and sell signals.
These are script generated signals. Not all scan results are shown here. The MACD signal should use with price action. Users must understand what MACD and price action are all about before using them. If necessary you should attend a course to learn more on Technical Analysis (TA) and Moving Average Convergence Divergence, MACD.
Once again, the website does not guarantee any results or investment return based on the information and instruction you have read here. It should be used as learning aids only and if you decide to trade real money, all trading decision should be your own.
