November 23, 2016
THANKSGIVING
This is a holiday shortened week, so get your trading in early if you have any trade plan.
The trading volume will be light this week, as the US markets are closed on Thursday for Thanksgiving and Friday is a half day.
US Stock Market Analysis
We will check a stock from different perspective. See below example for more.
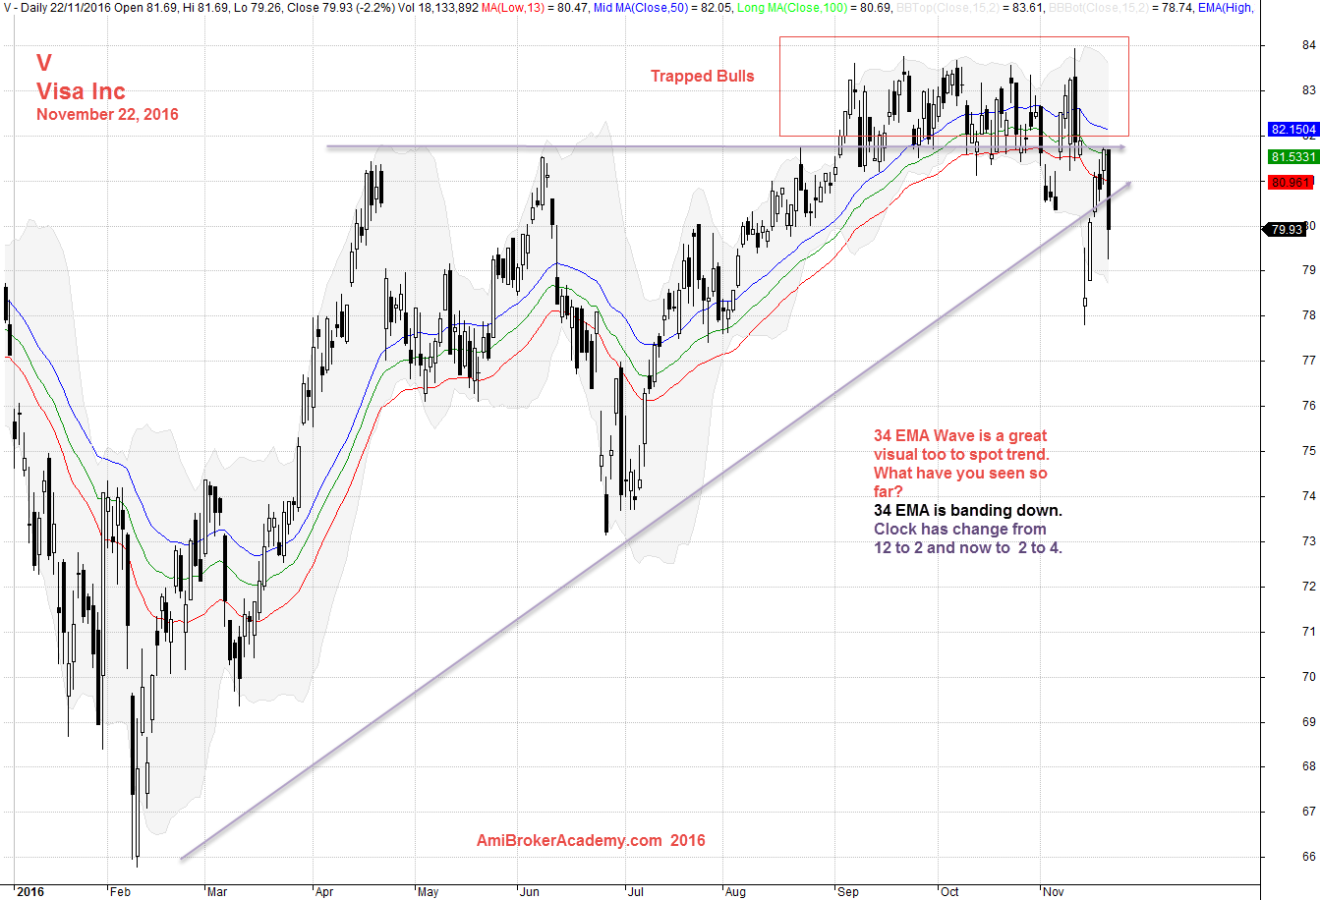
V | Visa Inc Stock Analysis – 34 EMA Wave
See, trapped bulls. Next check, we have a very powerful visual too, 34 EMA Wave. Where is the price action now? It was from bouncing above the 34 EMA wave, till now closed below and being resisted. The stock begin the reversal or just a routine bullback. You guess.

November 22, 2016 Visa Inc Stock Analysis – Trapped Bulls
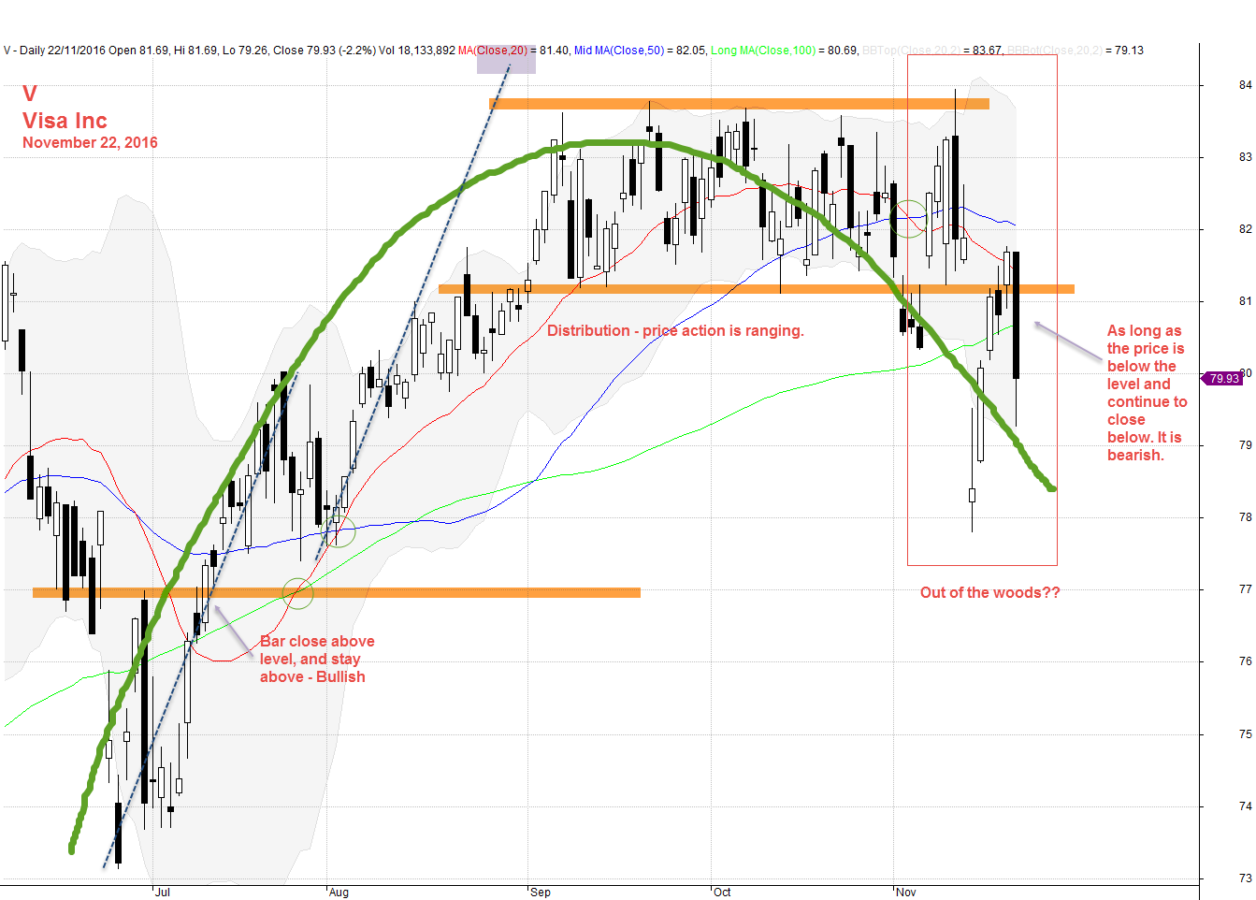
V | Visa Inc Stock Analysis – Out of Distribution
The price action is now break away from the distribution mode. The price action crosses below fast MA and resisted by MA.

November 22, 2016 Visa Inc, Out of Woods – Distribution Mode
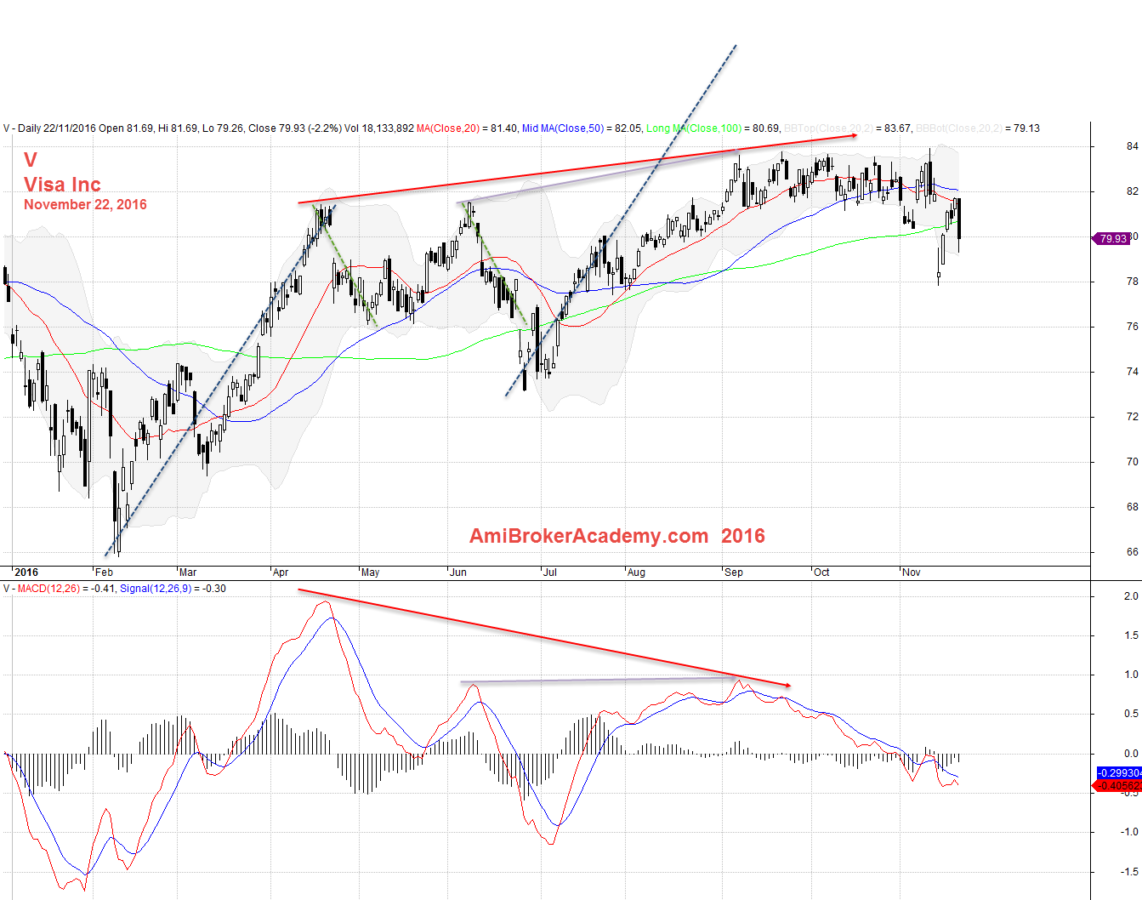
V | Visa Inc Stock Analysis – MACD Signal – Divergence
MACD is a leading indicator. It provides an early signal on trend change. Just watch out for the reversal, since MACD has signaled you.

November 22, 2016 Visa Inc – MACD Divergence
Moses Stock Scan
AmiBrokerAcademy.com
Disclaimer: All information, data and material contained, presented, or provided on amibrokeracademy.com is for educational purposes only. It is not to be construed or intended as providing trading or legal advice. Decisions you make about your trading or investment are important to you and your family, therefore should be made in consultation with a competent financial advisor or professional. We are not financial advisor and do not claim to be. Any views expressed here-in are not necessarily those held by amibrokeracademy.com. You are responsible for your trade decision and wealth being.
