February 26, 2018
Think Think got More Things
Be careful the price action suddenly shoot up, some thing must be “good”. A jump of near two dollars.
Powerful Chart Software – AmiBroker
The following chart is produced using AmiBroker charting software. It is a powerful chart software. You plot the stocks you are interested all in one chart, as long as you still could read them. See chart below. Thereafter slowly climb up, step by step.
Singapore Stock Analysis
C76 Creative Technology
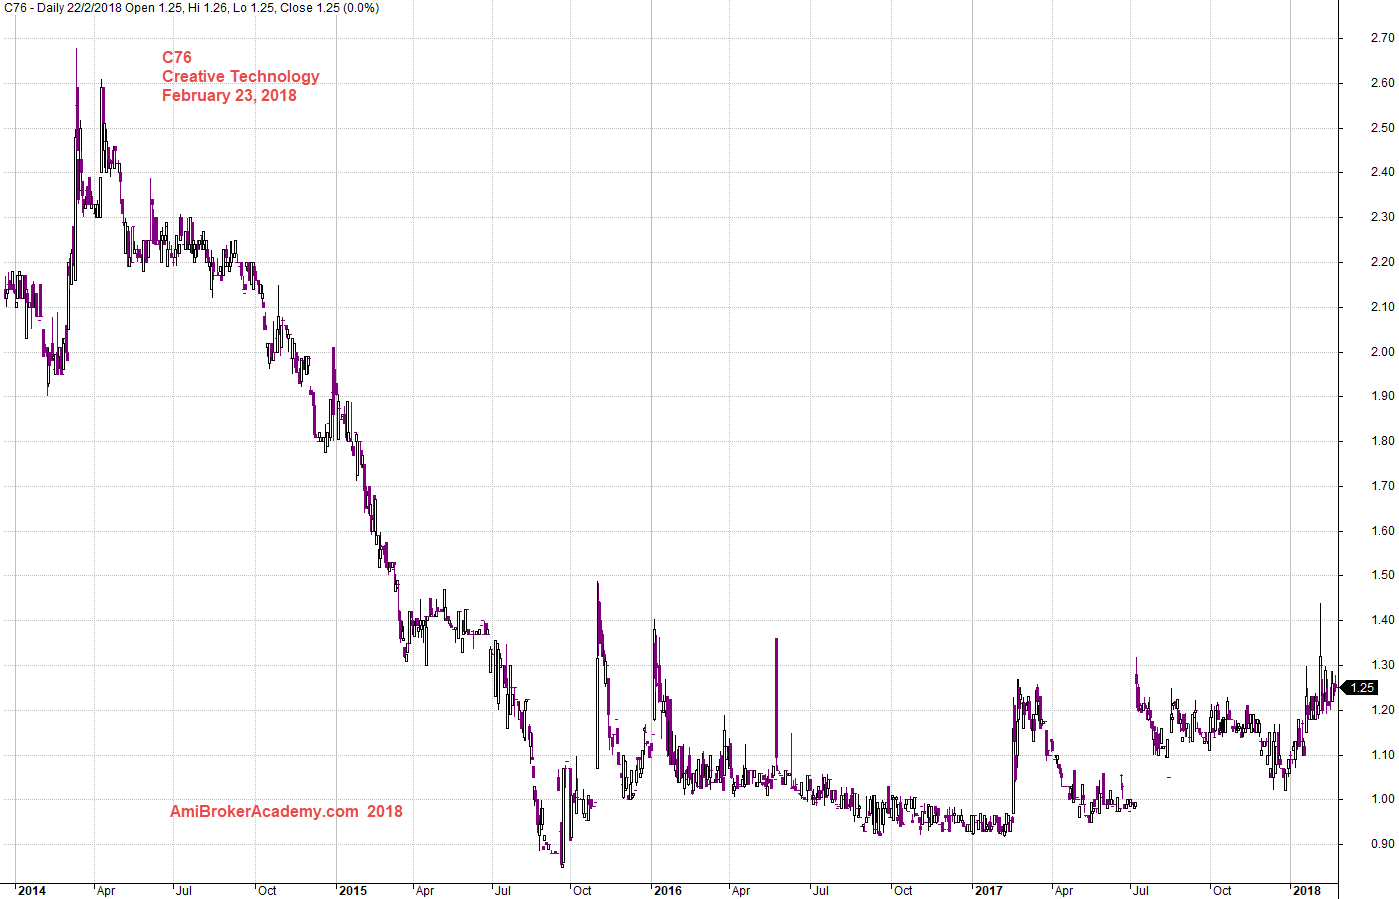
Study chart for more, picture worth a thousand words the price after try to reach the high of 2.70 in 2014 and fail, the price action struggle again to reach, now this time the price just could not have enough energy to hold the price. The price went below 90 cents in 2015. The market push the price back to 1.50. This seems to be the best price so far. Only until 2018, the price try to go back to 1.50 but fall short at slightly above 1.40.
Can the company become start again? Who will know? I don’t. By the way, do you know by 1995, Sound Blaster cards (products of Creative) had sold over 15 million units worldwide. In fact, the Sound Blaster family of sound cards was the de facto standard for consumer audio on PC. However, Microsoft Windows 95 has change the whole landscape.
Manage your risk!

20180222 Creative Technology Charting
C76 Creative Technology and MA Band
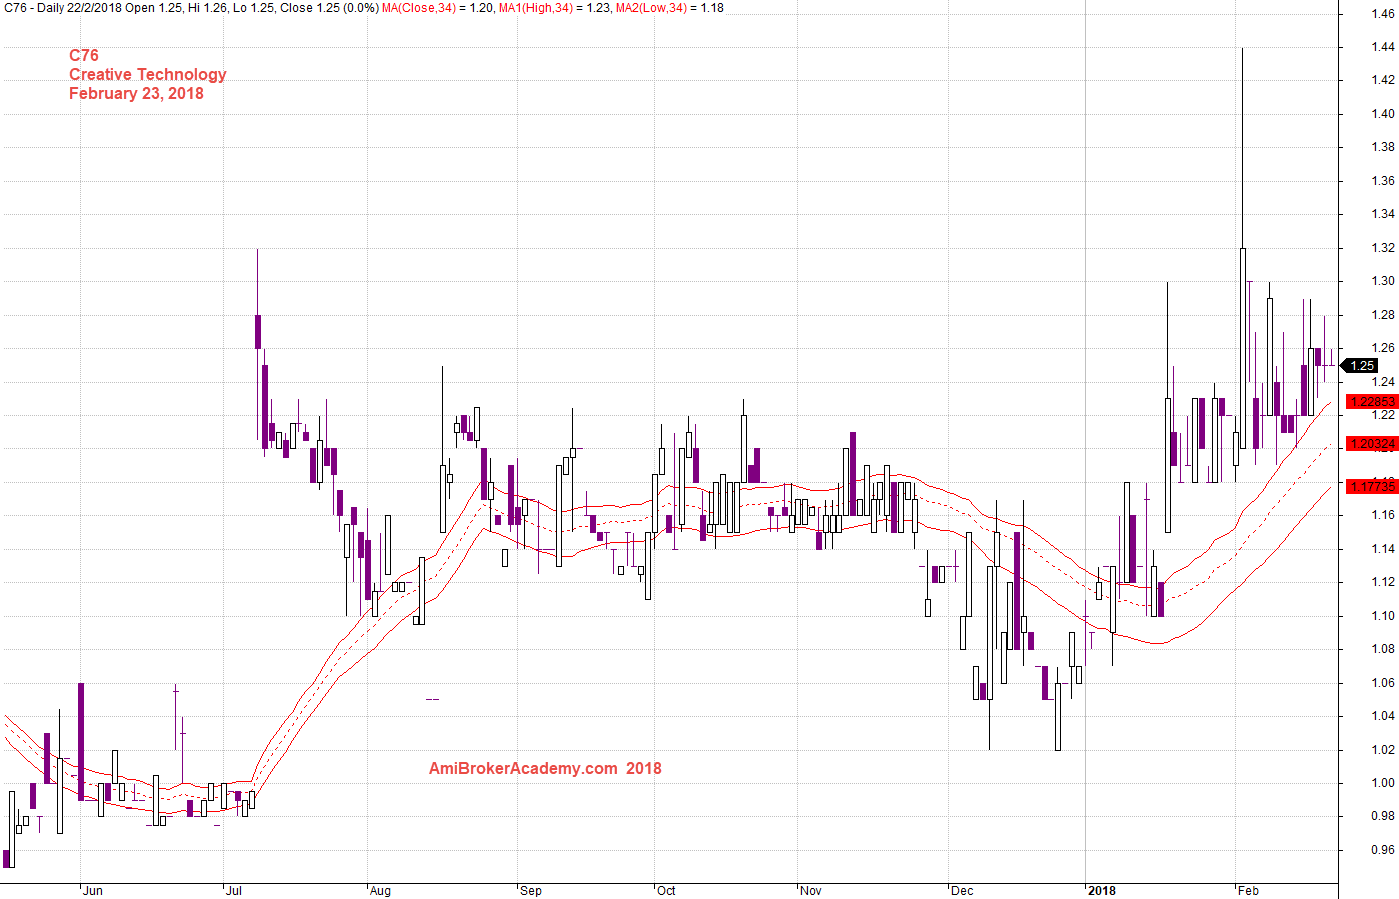
See chart, the price action closed above MA Band in 2018, and MA Band begin to slopping up. Bullish trend. 1.44 is the best for 2018.
Manage your risk!

20180222 Creative Technology and MA Band
C76 Creative Technology and MA Band
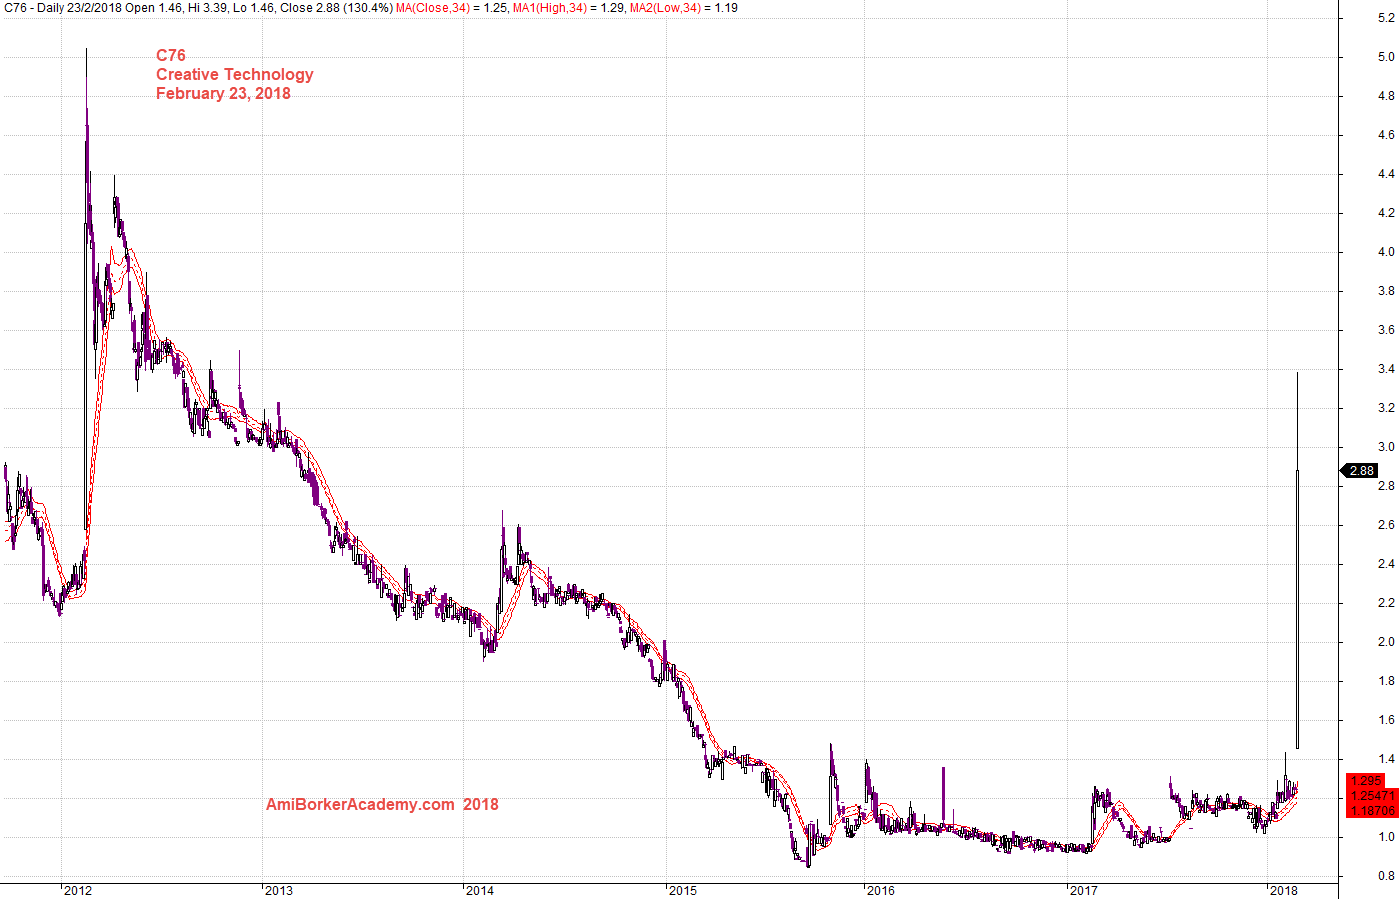
See chart, on February 23, 2018 the whole picture change, the price suddenly jump up from 1.44 to near 3.4. This is even higher than 2014 high. Why? The market think the price is cheap, it is the best time to buy. Can the price continue to go higher and breakout higher than 5.2 as shown the highest on the following chart. Will see.
Manage your risk.

20180223 Creative Technology and MA Band
Moses
AmiBrokerAcademy.com
Disclaimer
The above result is for illustration purpose. It is not meant to be used for buy or sell decision. We do not recommend any particular stocks. If particular stocks of such are mentioned, they are meant as demonstration of Amibroker as a powerful charting software and MACD. Amibroker can program to scan the stocks for buy and sell signals.
These are script generated signals. Not all scan results are shown here. The MACD signal should use with price action. Users must understand what MACD and price action are all about before using them. If necessary you should attend a course to learn more on Technical Analysis (TA) and Moving Average Convergence Divergence, MACD.
Once again, the website does not guarantee any results or investment return based on the information and instruction you have read here. It should be used as learning aids only and if you decide to trade real money, all trading decision should be your own.
