17 September 2016
Moses US Stock Analysis
Using NYSE Composite as example to analyse and understand the under current of the market. In additional to the indicator such as MACD to see the trend. We also study the candlestick, price action. Not using the candlestick chart pattern, but study the candlestick by candlestick. Picture worth a thousands word. The comments will help you to appreciate the trend and price action direction.

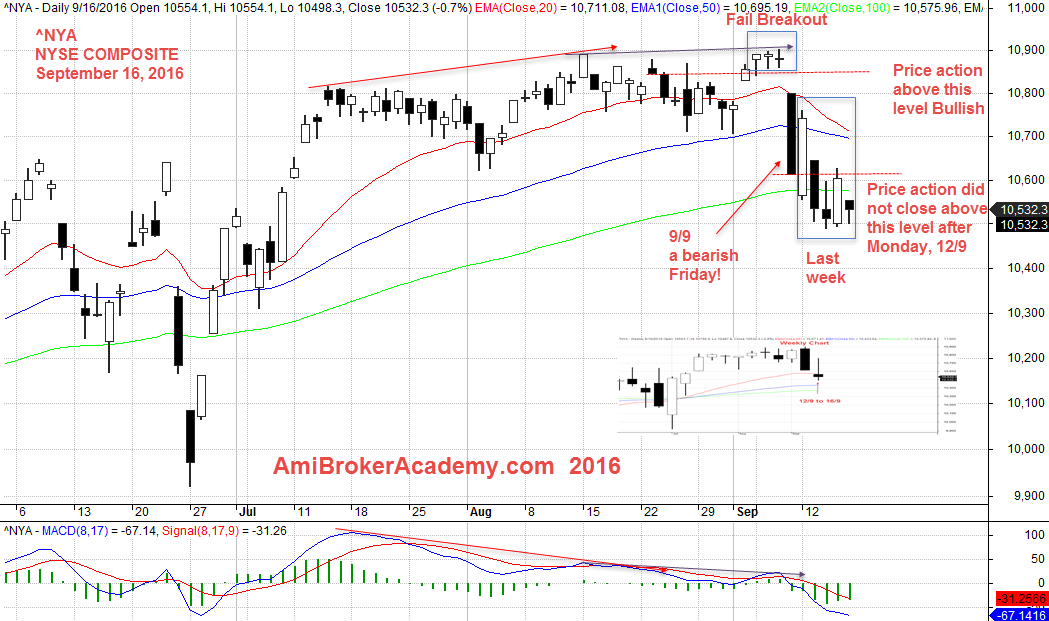
September 16, 2016 US NYSE Composite Daily
Many Bull Trapped
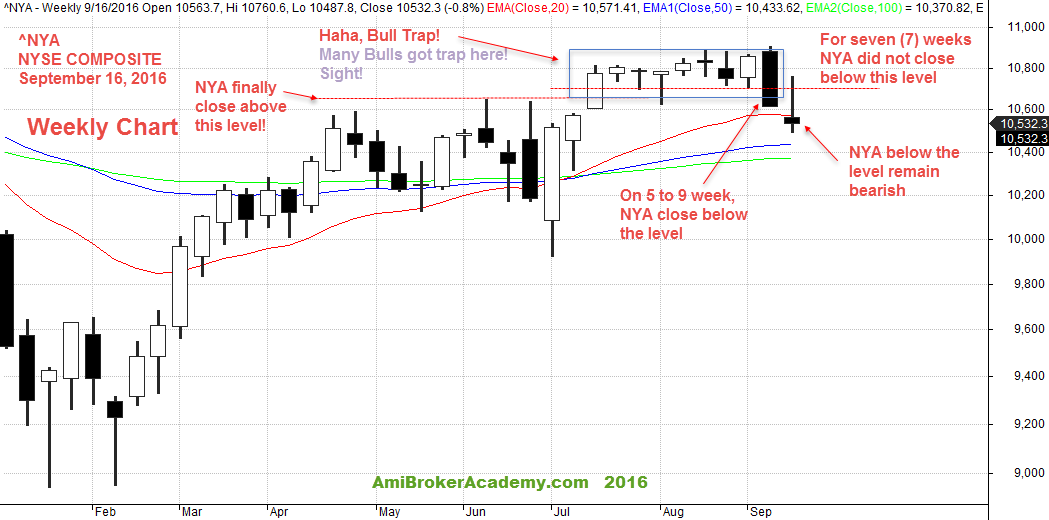
No Right No Wrong! If the level drawn is right, there are many bull trapped. Picture worth a thousand words. You have to read and appreciate the chart and comments.
From the chart NYA has closed below the key level, and become bearish. Last week, the bear won, and continue to close below the level; a long tail doji. Called it anything, the bear just drive the bull off. The market just do not have good sentiment although the data may looks the economy has been doing good.
Where is the Support?
Which level would hold the fall? Maybe at the bottom of the cluster! Will see!

September 16, 2016 NYSE Composite Weekly Chart
Unknown Reasons
There are many reasons cause the price action to travel south. Brexit, rate hike, and many unknown reasons.
Manage your risk.
Moses Singapore Stock Analysis
AmiBrokerAcademy.com
Disclaimer: All information, data and material contained, presented, or provided on amibrokeracademy.com is for educational purposes only. It is not to be construed or intended as providing trading or legal advice. Decisions you make about your trading or investment are important to you and your family, therefore should be made in consultation with a competent financial advisor or professional. We are not financial advisor and do not claim to be. Any views expressed here-in are not necessarily those held by amibrokeracademy.com. You are responsible for your trade decision and wealth being.
