Welcome to AmiBrokerAcademy.com.
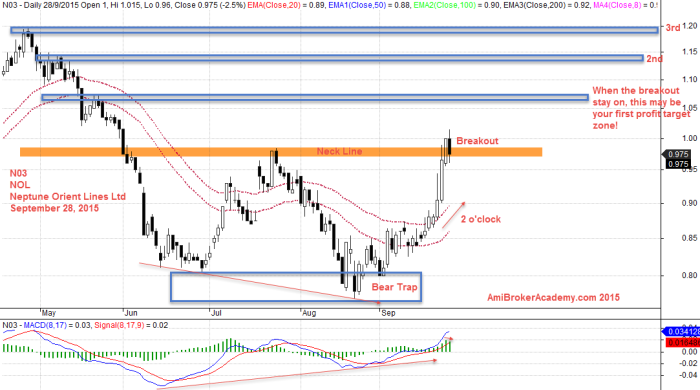
Last week, you said that double bottom coming; NOL stock. So, how? Have this happen? Only when the pattern is completed then you conclude the chart pattern is true.
Let’s see the chart on September 28, 2015 to confirm.
Price action has breakout of neckline, and retested the neckline. You can enter the market at the last high, if the bullish persisted. Watch out for these profit targets, as the bullish may get weaken. Check the MACD Histogram for clue.
Remember, all set up may fail. Have fun!
Read our previous NOL analysis;
NOL | Neptune Orient Lines Limited | Moses’ Stock Column
Thanks for visiting the website. You can read about other stock scan and analysis here.
Moses
Disclaimer: All information, data and material contained, presented, or provided on amibrokeracademy.com is for educational purposes only. It is not to be construed or intended as providing trading or legal advice. Decisions you make about your trading or investment are important to you and your family, therefore should be made in consultation with a competent financial advisor or professional. We are not financial advisor and do not claim to be. Any views expressed here-in are not necessarily those held by amibrokeracademy.com. You are responsible for your trade decision and wealth being.

