^STI – Bullish or Bearish
As said, the market are very uncertain and volatile. The Brexit has resulted great volatility! Buy or sell are all risky! The institution and traders are easily panic and response to market in selling to exit their position and quickly buy up to cover their loses. There are no right and wrong answer to react to news.
Manage Your Risk
Manage your risk and trade accordingly! As said no right no wrong. Take the money on the table and cut your losses quick. Money in your pocket is yours, but the paper money is just not real.
Picture Worth a Thousand Words
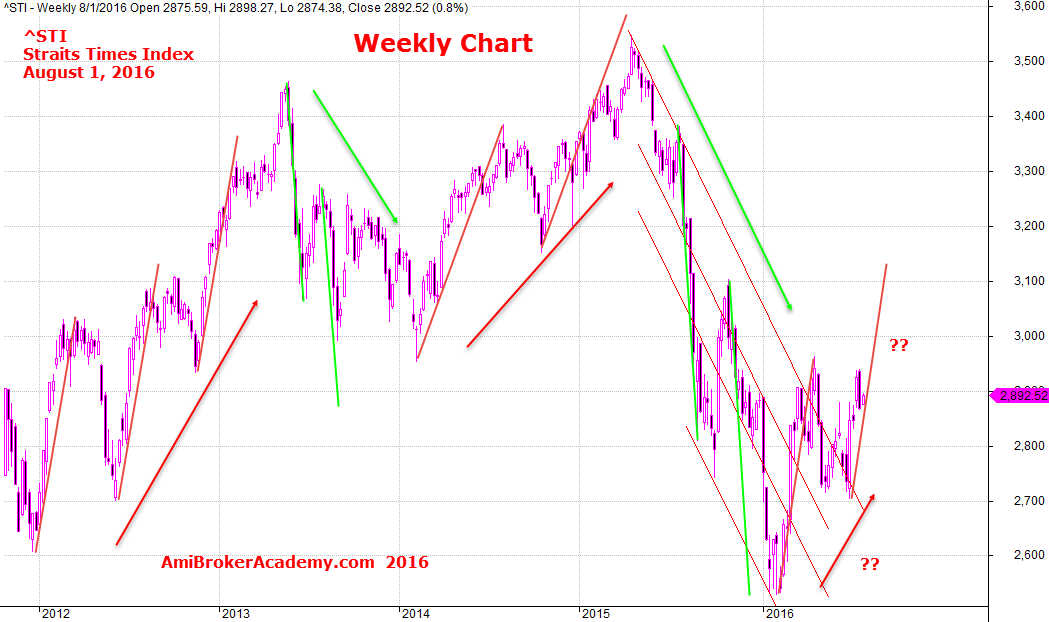
Picture worth a thousand words, even the short term could be on an uptrend. The over all trend, is still bearish. We do not see a reversal pattern. Why?
If you can’t see the trend, open a higher time frame chart such as weekly. In the chart has data from 2012, ^STI went through uptrend, followed by bearish trend, and bullish again, then bearish. But the bearish trend has no sign in changing. Why you may ask. Simple, we do not see the new high is higher than the recent high.
Do you want to catch the falling knife? Will the recent bullback if get followed the AB = CD pattern, there is a chance.
August 1, 2016 Straits Times Index Weekly

August 1, 2016 Straits Times Index, ^STI Weekly Chart
Moses Stock Analysis and Scan
AmiBrokerAcademy.com
Disclaimer: All information, data and material contained, presented, or provided on amibrokeracademy.com is for educational purposes only. It is not to be construed or intended as providing trading or legal advice. Decisions you make about your trading or investment are important to you and your family, therefore should be made in consultation with a competent financial advisor or professional. We are not financial advisor and do not claim to be. Any views expressed here-in are not necessarily those held by amibrokeracademy.com. You are responsible for your trade decision and wealth being.
