Neptune Orient Lines Limited, N03
Moses Singapore stock analysis. Neptune Orient Lines Limited, commonly known as NOL, stock code N03.
It is one of the stocks popular among the traders and investors. The name often surface up in any stock seminar or workshop to ask for the prediction. Where will the price goes?
This is a common problem with many of the traders. Instead of doing their own analysis and homework, they like to find out what others think. It is always difficult to decide a news is a good news or bad news till when the results is confirmed.
Fundamental
There are always too many news of a company data to be read and understood. To become an expert to under what you read and know the company well it is almost impossible for a normal person doing it single handed in a short time, give it a few months or may be a few years.
The company hire many staff, but how many do understand the company and their direction. Many not even know the entire company except their own functional area they were assigned to handle.
Technical Analysis
Technical Analysis, as some commended, it is a lazy man tool to understand a company. Technical Analysis basically looks at the stock chart, see the price action, the volume and analysis the trend and predict the future or next possible action.
Why TA is a lazy man way (tool) to understand a company? Because, the price action is a result of traders and investors. It has taken in all the market news and emotion that had already digested and applied.
There was so much news about a company and released each day. Many are not available to the public or published by newspaper. Instead of try to read them all and understand why not just focus on the chart and analysis the chart.
Analysis
1) Thinking Out Loud
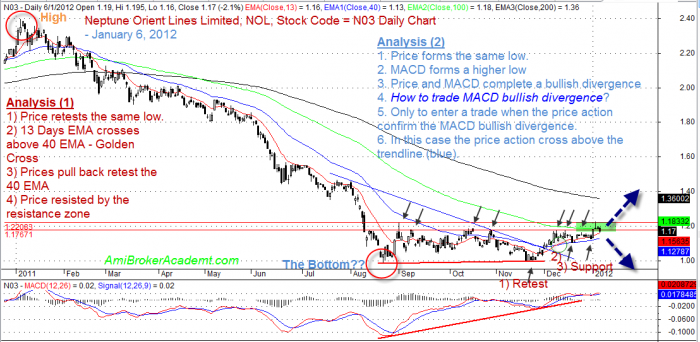
NOL has fallen from the high of $2.38 to the low of $0.98, in the last 52 weeks. Now the price has bounced back to $1.17. The price has been fallen by half in one year. Is it already at the bottom? Can we catch the bottom? Buy low and sell high? What will the price action like for 2012? Return to the high $2.38 and goes higher? Who will know? Not even the company itself.
Who has the crystal ball that gazes into the future?
With the economy that are gloomy, eurozone debt crisis remain unresolved, and consumer remain weak. Everyone will expect a global slowdown for shipping and logistic, in fact the manufacturing is expected even slower. The demand for products will reduce.
Many of large or global corporation has already cutting their budget for 2012. They are control their spending and extend the life of any replacement of the existing equipment or facility.
Unless NOL has some diversification that has installed ahead of 2012, the slowdown is definitely going to impact the 2012 revenue.
As trader, do you really care? Price is always moving in zigzag manner. The price moves because there is equal buyer and seller. So, just follow the rhythm “buy low and sell high”. Of course, try not to buy high and try to sell higher.
2) What the Chart has told you so far? Read this with the chart.
Moving Average:
a) Price has supported around $0.98 again; ie retest the same low.
b) We also see the 13 period or 13 days in this case EMA has crossed above 40 EMA; Golden Cross.
c) Price action has been pulled back to retest 40 EMA.
d) We see price action resisted by the resistance zone. Can the price action break above the zone? Will see.
e) From a bullish point of view, it is positive for price action to travel above 13 EMA and 40 EMA.
MACD:
a) Price formed the same low and MACD formed a higher low; this is MACD bullish divergence. Although this is not a perfect MACD bullish divergence.
b) To confirm the MACD bullish divergence, it has to confirm with the price action. In other word there must be a break up on the trendline.
c) How to trade the MACD bullish divergence?
d) One, enter when the price action break up the trendline. Has your stop loss one to two tick below the last low. Made the second entry after the retracement. This is what the professional will enter the trade.
3) To summarise.
a) There is a double bottom (test and retest)
b) There is a confirmed MACD bullish divergence.
c) Is this a start of trend reversal?
Have fun! Trade with caution! Trade what you see and not what other think (and become you think)!
Moses, January 7, 2012
Ps As promised, I will do stock analysis from time to time.
DSICLAIMER
Information provided here is of the nature of a general comment only and no intend to be specific for trading advice. It has prepared without regard to any particular investment objectives, financial situation or needs. Information should not be considered as an offer or enticement to buy, sell or trade.
You should seek advice from your broker, or licensed investment advisor, before taking any action.
Once again, the website does not guarantee any results or investment return based on the information and instruction you have read here. It should be used as learning aids only and if you decide to trade real money, all trading decision should be your own.

