Moses’s US Stock Analysis, HiSoft Technology International Limited, HSFT Update
As promised, here is the analysis.
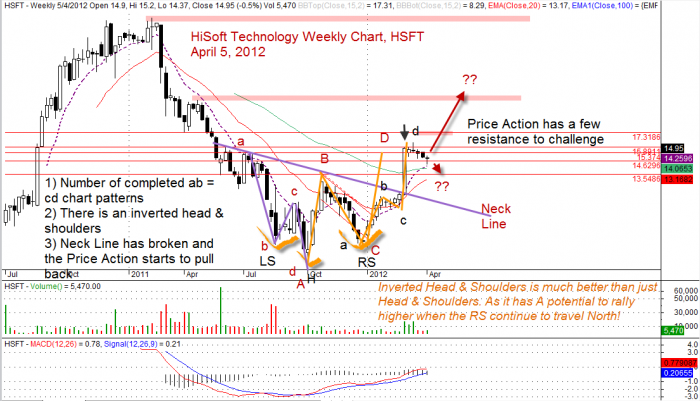
An inverted head and shoulders is much better than a normal head and shoulders, this is from a rally bullish point of view. When the inverted head and shoulders chart pattern remain valid will indicate that the price action remain bullish. This is good news for those traders, and investors whom have traded or invested on this counter.
Despite the market news and uncertainty, the HiSoft Technology has continued to rally.
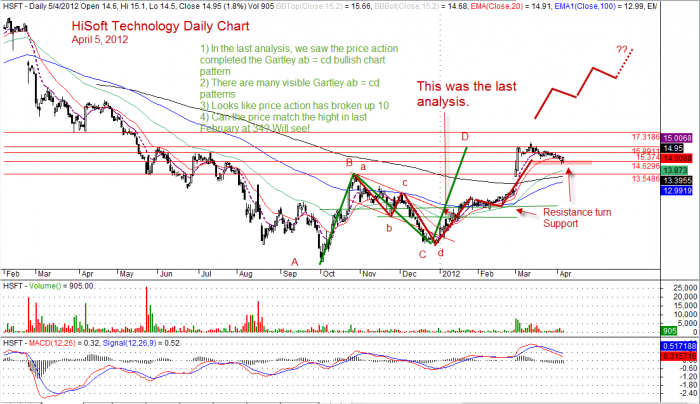
In the last analysis, we were looking at whether the price action could break up 10.58 after the bigger bear trap. Now the price action is at 14.95.
The price action is now above 200 EMA after completed number of Gartley AB = CD chart patterns. Now the price action is again caught between 20 and 50 EMAs. Where will the price action go after this? Can the price action hit the high of 34 since the stock listed? Will see.
A picture is worth a thousand words; see the following charts for the analysis. It may appear completed at first but it is very clear and simple to understand. Have fun!
Welcome to Moses’s Free Stock Corner Stock Analysis at AmiBrokerAcademy.com. You are here because you want to know why the stock moves or will it move in the near future.
HiSoft Technology Weekly Chart
HiSoft Technology Daily Chart
By Moses April 9, 2012
Disclaimer
The above result is for education purpose. It is not meant to be used for buy or sell decision. We do not recommend any particular stocks. If particular stock of such is mentioned, they are meant as demonstration of Amibroker as a powerful charting software, what Technical Analysis is, some indicators such as MACD, Support and Resistance, and Moving Averages.
Once again, the website does not guarantee any results or investment return based on the information and instruction you have read here.


