Singapore stock analysis. Bullish Flag Trend Continuation Pattern
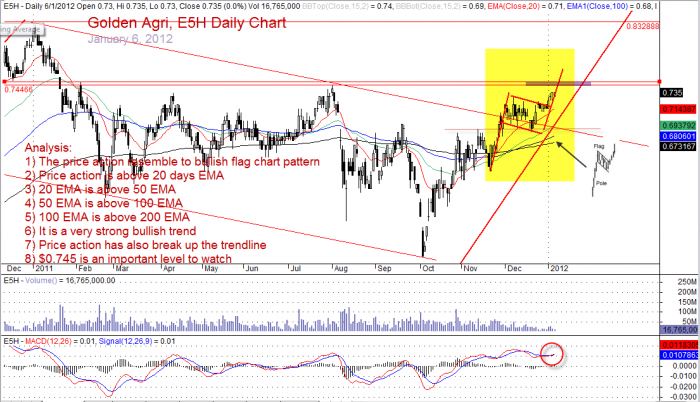
Golden Agri Resources Limited, E5H continues to be bullish for the whole last week. The price closed the week at $0.735. Golden Agri after a small pulled back then it broke out of the trend line or the equal channel. The price action continues to stay bullish. Will this trend continue for next week? Who will know?
Remember price is always moving in zigzag manner. There is equal number of buyers and sellers.
Analysis
The price action is flying above 20 days EMA, Exponential Moving Average. The 20 EMA is above the 50 EMA. The 50 EMA is above the 100 EMA. The 100 EMA is above 200 EMA. It is a nice bullish trend.
A bullish flag trend continuation pattern starts to take shape. However, there is a critical level at $0.745 to watch. The price action may react to the level. Trade with caution!
An early post on December 27, showed a weekly chart and analysis that have many bullish flag trend continuation patterns.
Trade what you see and not what you think.
Golden Agri Resources Daily Chart
Link
Moses, January 8, 2012
DSICLAIMER
Information provided here is of the nature of a general comment only and no intend to be specific for trading advice. It has prepared without regard to any particular investment objectives, financial situation or needs. Information should not be considered as an offer or enticement to buy, sell or trade.
You should seek advice from your broker, or licensed investment advisor, before taking any action.
Once again, the website does not guarantee any results or investment return based on the information and instruction you have read here. It should be used as learning aids only and if you decide to trade real money, all trading decision should be your own.

