November 22, 2018
DBS Bank Stock | D05 | DBS Group Holdings Stock Charting | AmibrokerAcademy.com
Last week we did a few analysis for DBS bank but didn’t post. Think think got more things. So, thought to share here just for reference.
You may ask what so great, the true is this is nothing since the analysis is done what waste it. Enjoy reading the post.
Remember, our interest here is focus on stock price and not company. Please do not get it mix up.
Thanks for visiting the site.
There is a reason for everything. Perhaps at the moment you do not have the answer.
Moses Stock Analysis
D05 DBS Group Holdings Stock Charting
Buy low sell high, buy support sell resistance.
Each time you look at the chart, you may have different ah ha. See chart, the price action of DBS Group Holdings stock chart.
Do you know what is ah ha? Ah ha or aha is at a point in time, event, or experience when one has a sudden insight or realization. For example, you may have aha moment when you try to put on your shorts from last summer and they didn’t fit.
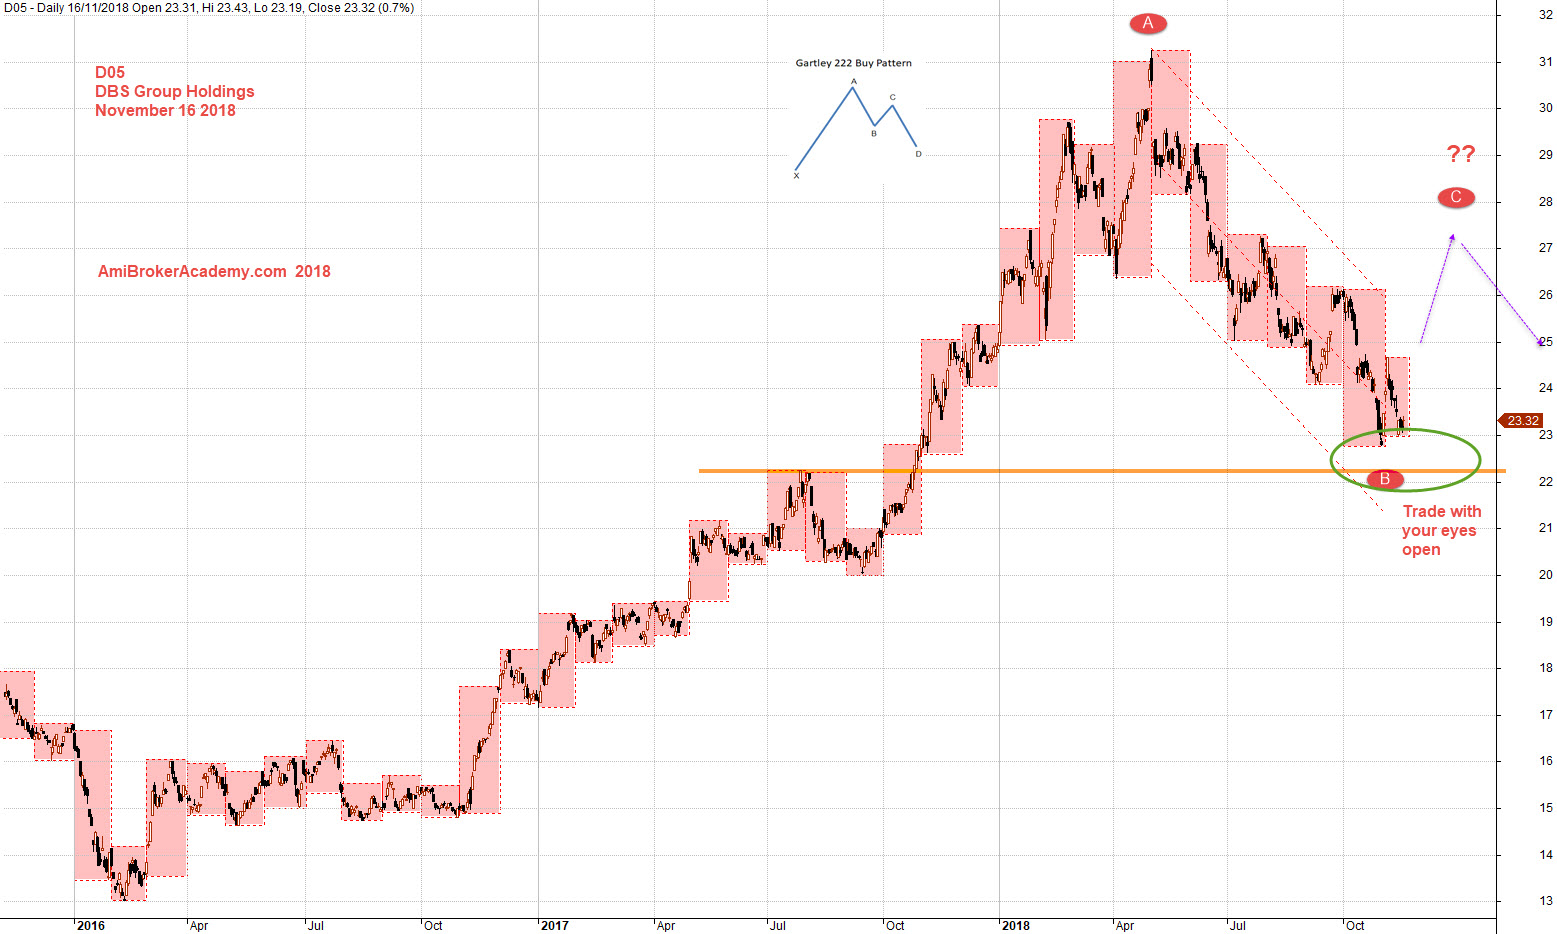
Apply buy low sell high and buy hold strategy. For this stock it is really a great stock, see chart, the stock price from the low at 13 dollars to the high at 31 dollars, for less than eighteen months. Now the stock has been brought down to 23 dollars. For BHS and you did not taking profit so far, you will feel the pain. So, as TA thought you, take profit when the price action close below the bull trendline. Of course no right no wrong. May for the next moment, the price may go beyond 31 dollars again. But, but this our new H M Gartley 222 new pattern again, imagine if what we see the BC leg and future CD leg, the price action could bring it down to the start point agin.
So, trade with eyes open, manage your risk.

November 16, 2018 DBS Group Holdings and H M Gartley 222
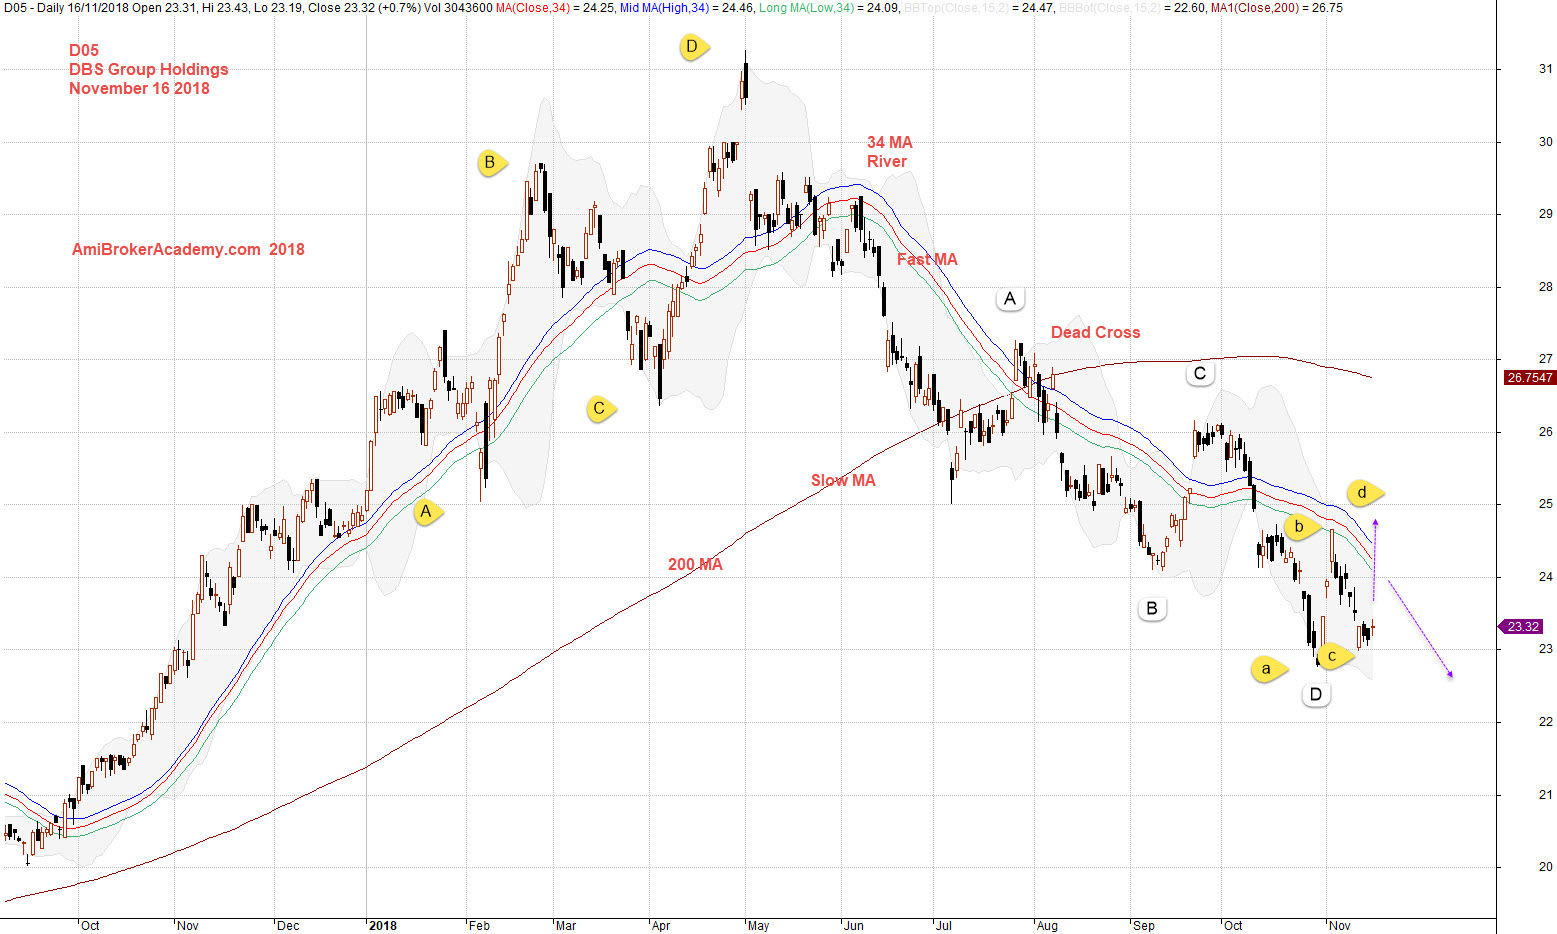
Using “visual tool’, moving averages. See chart.

November 16, 2018 DBS Group Holdings and River
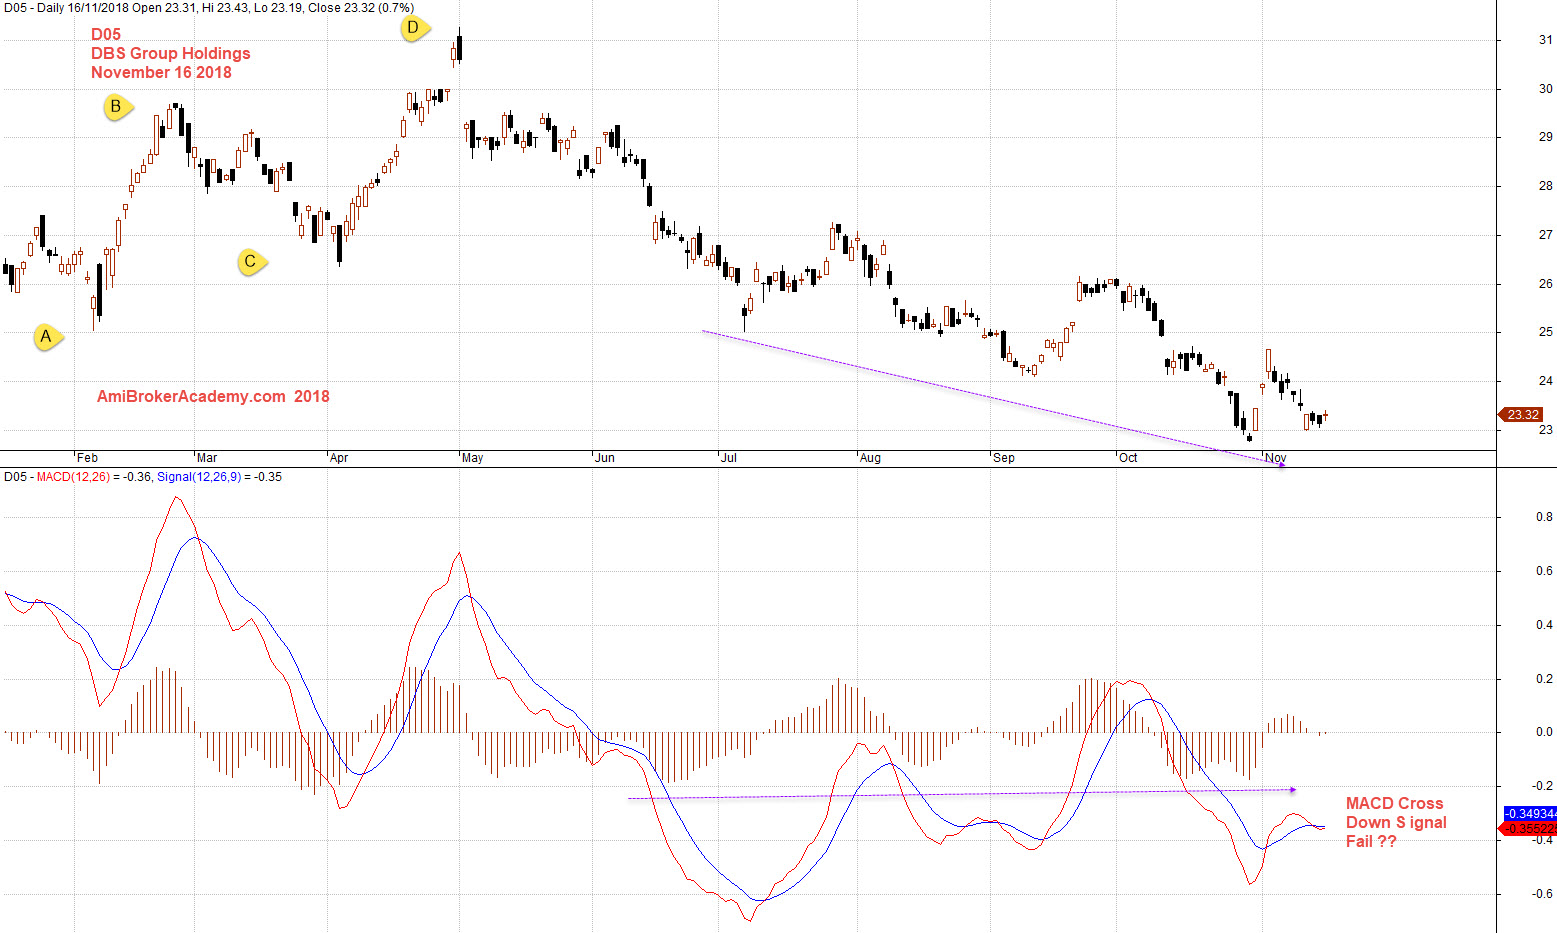
Add MACD indicator, see chart.

November 16, 2018 DBS Group Holdings and MACD
Moses
AmiBrokerAcademy.com
Disclaimer
The above result is for illustration purpose. It is not meant to be used for buy or sell decision. We do not recommend any particular stocks. If particular stocks of such are mentioned, they are meant as demonstration of Amibroker as a powerful charting software and MACD. Amibroker can program to scan the stocks for buy and sell signals.
These are script generated signals. Not all scan results are shown here. The MACD signal should use with price action. Users must understand what MACD and price action are all about before using them. If necessary you should attend a course to learn more on Technical Analysis (TA) and Moving Average Convergence Divergence, MACD.
Once again, the website does not guarantee any results or investment return based on the information and instruction you have read here. It should be used as learning aids only and if you decide to trade real money, all trading decision should be your own.
