December 31 2020
This is not an ordinary stock charting site.
We are different. Have fun!
我们就是不—样的!把股价用图表达。
Planning for 2021 Trades
Welcome to AmiBroker Academy dot com. Thanks for searching and landed here. We use organic search to surface this site. If you find the site through some keywords. We would like to congratulate you. Good job and have fun!
BABA | Alibaba Group Holding Stock Charting From IPO
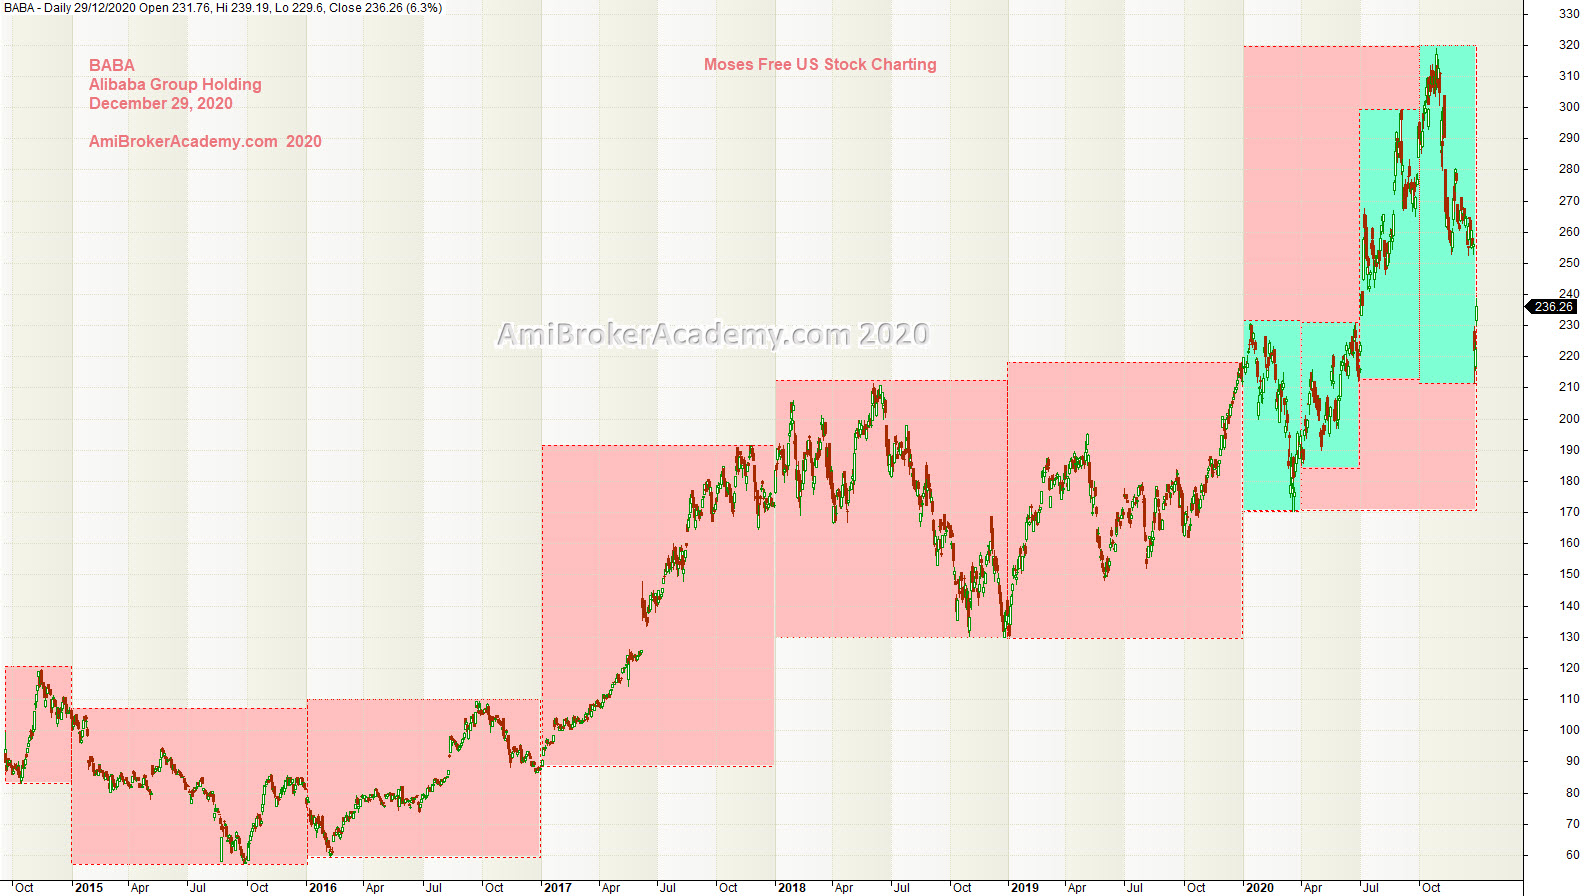
Picture worth a thousand words, see chart. Price Action shot up in 2020. But has a major pullback in October. Price Action is now submerged below last year high. Although 2020 is a great year for Alibaba. Now all earning are gone, effort wasted.
2018, and 2019 are same or about the same year high. Price Action supported at same level, strong. Last two years low are not very far from the IPO price.
If the price action continue to fall, it is very soon to hit the last two years low and next IPO issue price. Manage your risk.
Those has used buy and hold strategy since IPO are sweeting. This stock has made many whom buy hold to worry in 2015, 2016, 2018 and now again.

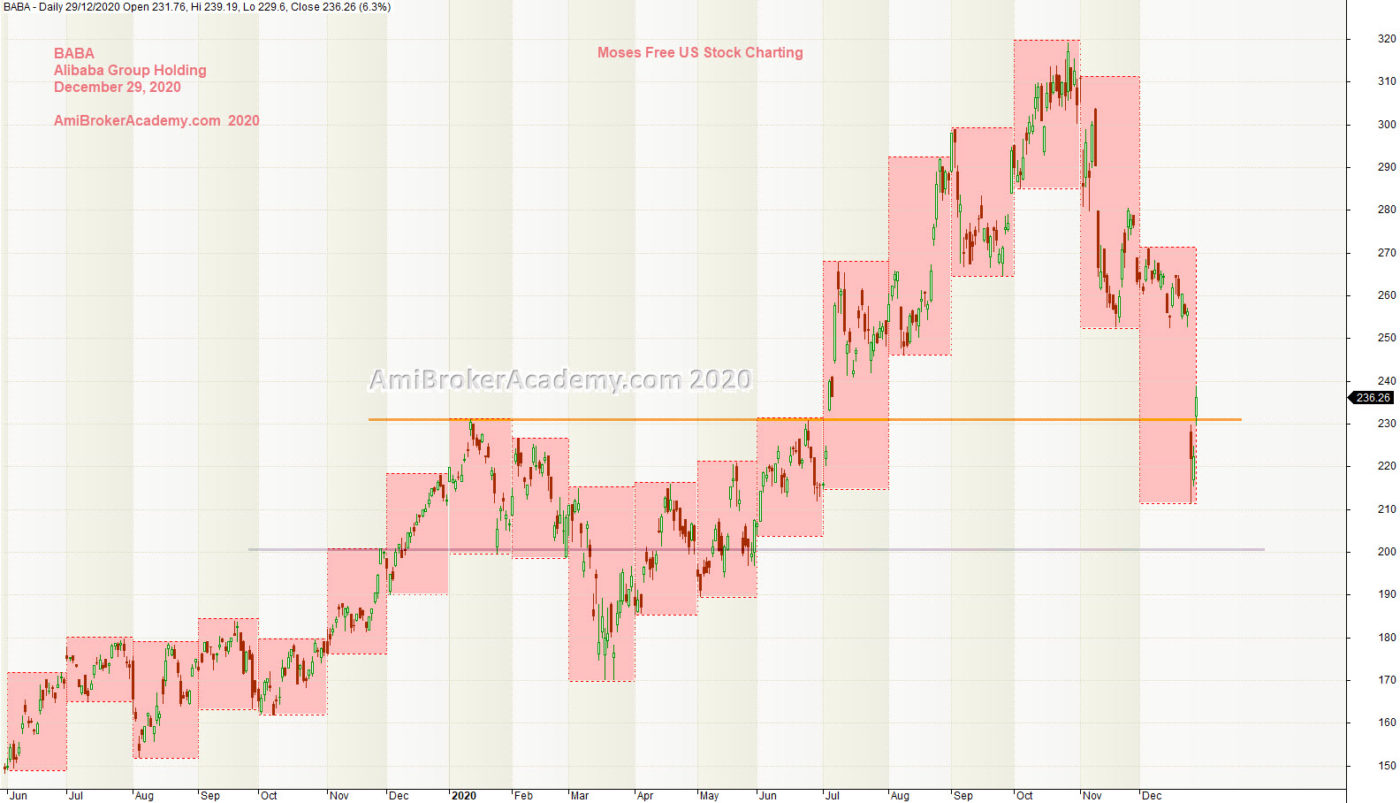
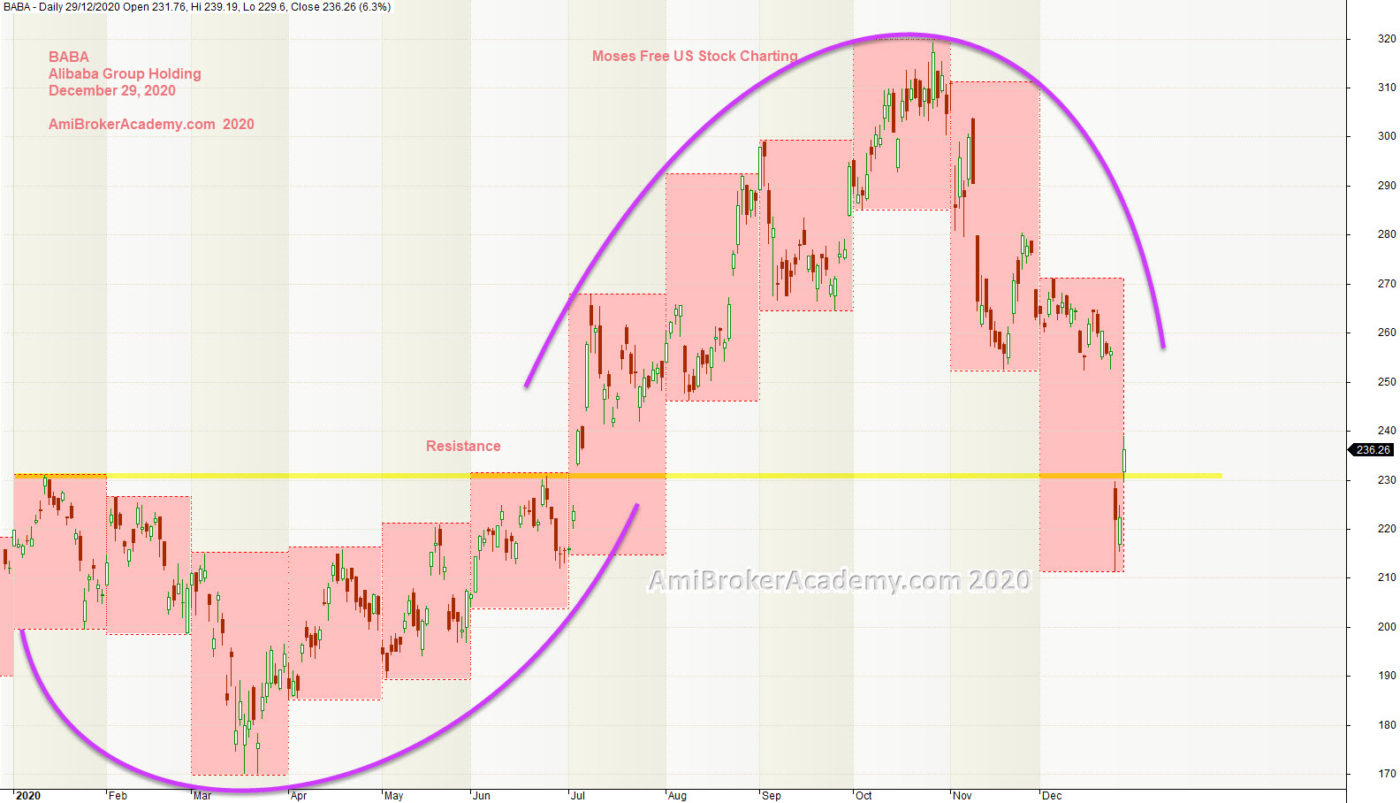
BABA | Alibaba Group Holding Stock Charting and Eighteen Months Data

GOOG | Alphabet Inc Stock Charting for Last Twelve Months

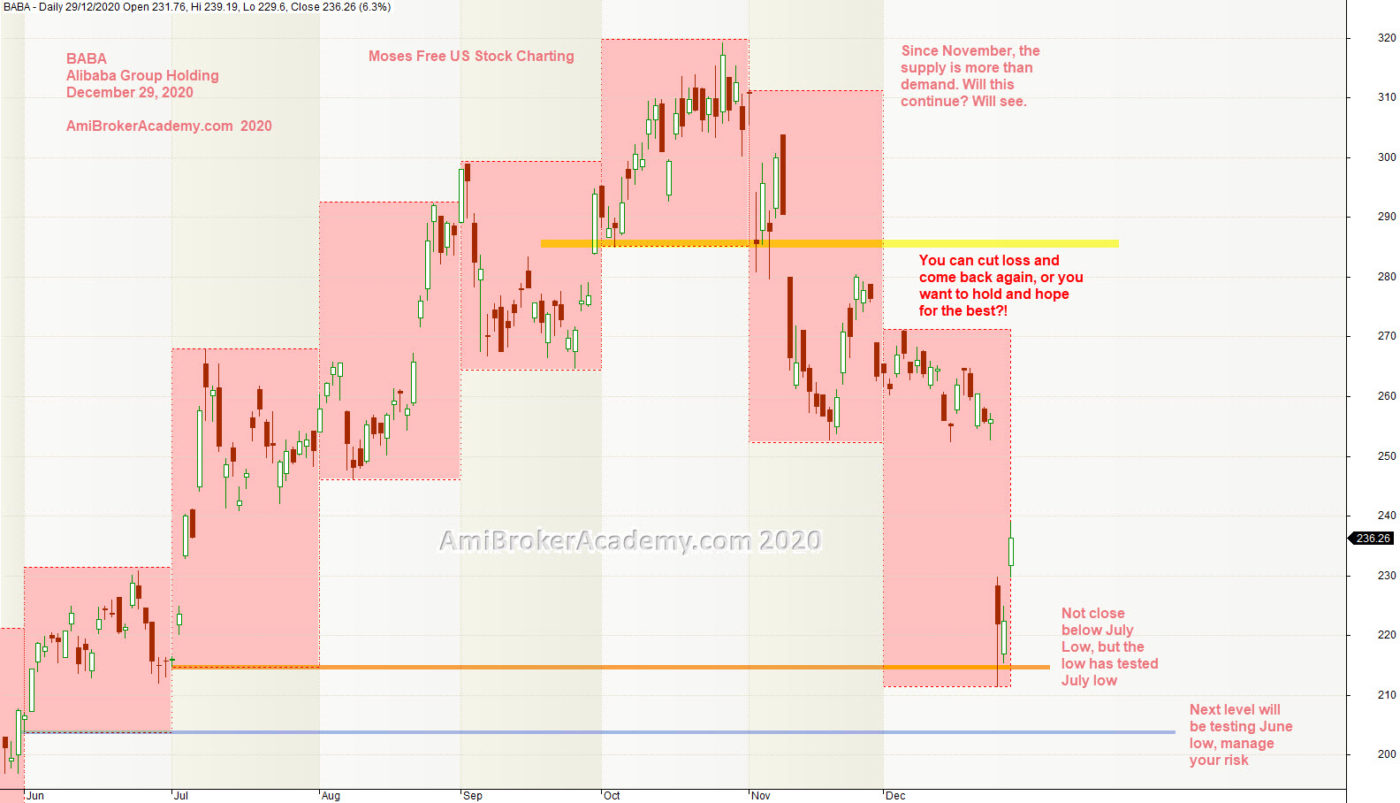
BABA | Alibaba Group Holding Stock Chart and Six Months Data
Price Action has pullback and test July low. Next June.

From a supply and demand stand points, now the supply is more than demand. Many are cutting lost or taking the money on the table. Again, manage your risk.
Picture Worth a Thousand Words
Moses Free Stock Charting
Official AmiBrokerAcademy.com Charting
Disclaimer
We do not recommend buy or sell of any financial instrument. All information post here is to show the power of Amibroker charting software and technical analysis (TA). If you do not know what is TA, please find a training to go through.
