Market remains soft, Singapore market index, Straits Times Index, STI is flat for the day closed on November 24, 2011. The index at 2677.15, a mere 0.58 points up. Only the following 8 stocks pass the scan criteria, for volume exceeding 100K and price above $1.
| Ticker | Type | Close | Vol.(K) | Screening Result |
| 600 | bullish |
1.2 |
662 |
MACD +ve Divergence |
| B2W | bearish |
2.52 |
100 |
MACD Cross-Down Signal |
| C38U | bullish |
1.775 |
5514 |
MACD Cross-Up Signal |
| CC3 | bullish |
2.92 |
2951 |
MACD Cross-Up Signal |
| JS8 | bearish |
1.29 |
1549 |
MACD Cross-Down ZeroLine |
| ME8U | bullish |
1.09 |
1233 |
MACD Cross-Up Signal |
| S68 | bullish |
6.06 |
1460 |
MACD-H +ve Divergence |
| U96 | bearish |
4.07 |
2381 |
MACD Cross-Down ZeroLine |
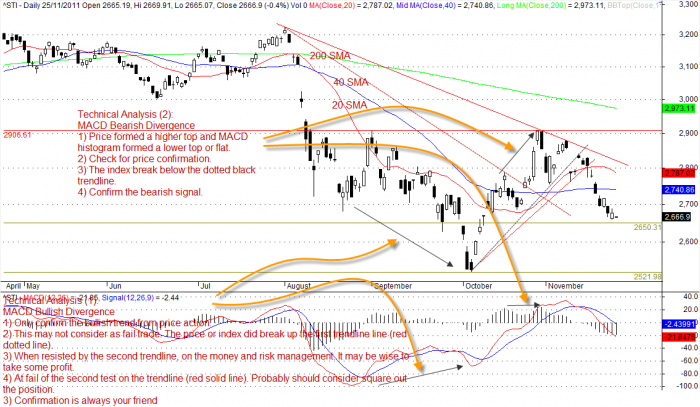
Enclosed please find the Straits Time Index, ST Index chart from AmiBroker and the technical analysis using MACD indicator. There were both MACD Bullish Divergence and MACD Bearish Divergence.
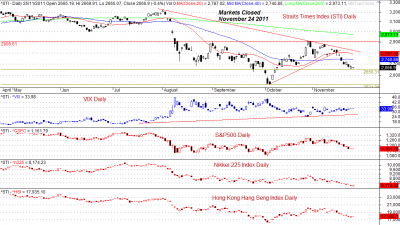
Enclosed please a chart on indices using AmiBroker powerful charting software, you can see key Asia markets and US markets indices at a glance.
Disclaimer
The information presented here is for illustration purpose. It is not meant to be used for buy or sell decision. We do not recommend you trade base on what you read here. If particular strategy, technique, trigger are mentioned, they are meant as demonstration how it being used by some trader.
Trading in any financial instrument such as stocks, options, indices, currencies and future involve risk and should not undertake without learning from professional traders. Readers may carry out trading based on what they learnt, but all risks and potential financial losses are the readers own responsibility.


