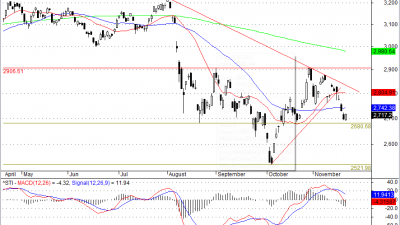
Singapore stocks market after having bearish for the last five days, today it closed with Straits Times Index 19.22 points above yesterday closed.
Using MACD scanner, find the following 13 Singapore stocks with the value greater than $1 and have the volume greater than 100 K showing MACD High Probability trade signals.
MACD makes up of 2 lines, the MACD Line and MACD Signal Line. MACD helps to spotting early trend change such as early bullish or bearish trade signal. However, need to confirm the signal with price action. MACD common setting is (12,26,9)
| Ticker | Company | Date | Type | Close | Vol.(K) | Screening Result | |
|
1 |
C31 | CAPITALAND LIMITED |
22/11/2011 |
bearish |
2.5 |
20063 |
MACD Cross-Down ZeroLine |
|
2 |
MS7 | STX OSV HOLDINGS LIMITED |
22/11/2011 |
bullish |
1.145 |
10683 |
MACD Cross-Up Signal |
|
3 |
C38U | CAPITAMALL TRUST |
22/11/2011 |
bullish |
1.77 |
3457 |
MACD-H +ve Divergence |
|
4 |
CC3 | STARHUB LTD |
22/11/2011 |
bullish |
2.87 |
1920 |
MACD Cross-Up ZeroLine |
|
5 |
S68 | SINGAPORE EXCHANGE LIMITED |
22/11/2011 |
bullish |
6.14 |
1651 |
MACD-H +ve Divergence |
|
6 |
600 |
HYFLUX LTD |
22/11/2011 |
bullish |
1.205 |
1287 |
MACD-H +ve Divergence |
|
7 |
H13 | HO BEE INVESTMENT LIMITED |
22/11/2011 |
bearish |
1.22 |
1225 |
MACD Cross-Down Signal |
|
8 |
J85 | CDL HOSPITALITY TRUSTS |
22/11/2011 |
bearish |
1.565 |
724 |
MACD Cross-Down ZeroLine |
|
9 |
J69U | FRASERS CENTREPOINT TRUST |
22/11/2011 |
bearish |
1.44 |
705 |
MACD Cross-Down Signal |
|
10 |
U14 | UOL GROUP LIMITED |
22/11/2011 |
bearish |
4.33 |
395 |
MACD Cross-Down ZeroLine |
|
11 |
P34 | PETRA FOODS LIMITED |
22/11/2011 |
bearish |
1.72 |
330 |
MACD Cross-Down ZeroLine |
|
12 |
J0R | DBXT MSCI RUSSIA CAP 25 ETF 10 |
22/11/2011 |
bearish |
2.85 |
281 |
MACD Cross-Down ZeroLine |
|
13 |
AU8U | CAPITARETAIL CHINA TRUST |
22/11/2011 |
bullish |
1.145 |
106 |
MACD-H +ve Divergence |
The above result is for illustration purpose. It is not meant to be used for buy or sell decision. We do not recommend any particular stocks. If particular stocks of such are mentioned, they are meant as demonstration of Amibroker as a powerful charting software and MACD characteristics. Amibroker can program to scan the stocks for buy and sell signals.
These are script generated signals. Not all scan results are shown here. The MACD signal should use with price action. Users must understand what MACD and price action are all about before using them. If necessary you should attend a course to learn more on Technical Analysis (TA) and Moving Average Convergence Divergence, MACD.
Once again, the website does not guarantee any results or investment return based on the information and instruction you have read here.

