September 16, 2017
Hello!
Thanks for visit the site again, if you are the regular here you will know that we like to google our past work to see how much we understand the technical analysis technique we learnt so far. We started this website back in 2009, we have accumulate enough of the work chart analysis. We do sometime take a break (no posting or analysis). But, we try our best to post the work as much as we can.
Alibaba is one of the stock we analyse, see the following analysis we did in the past.
Gartley 222
Hope you can appreciate the Gartley, H M Gartley pattern. We see AB = CD chart pattern.
Moses’ US Stock Analysis – Alibaba Group, BABA Stock Price Update

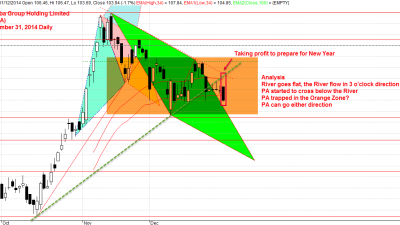
US Stock Alibaba Group, BABA December 31, 2014
Our Analysis Back Then
Crystal Ball; Alibaba Group stock price analysis,
1) River goes flat, the River flow in 3 o’clock direction
2) PA started to cross below the River
3) PA trapped in the Orange Zone?
4) PA can go either direction
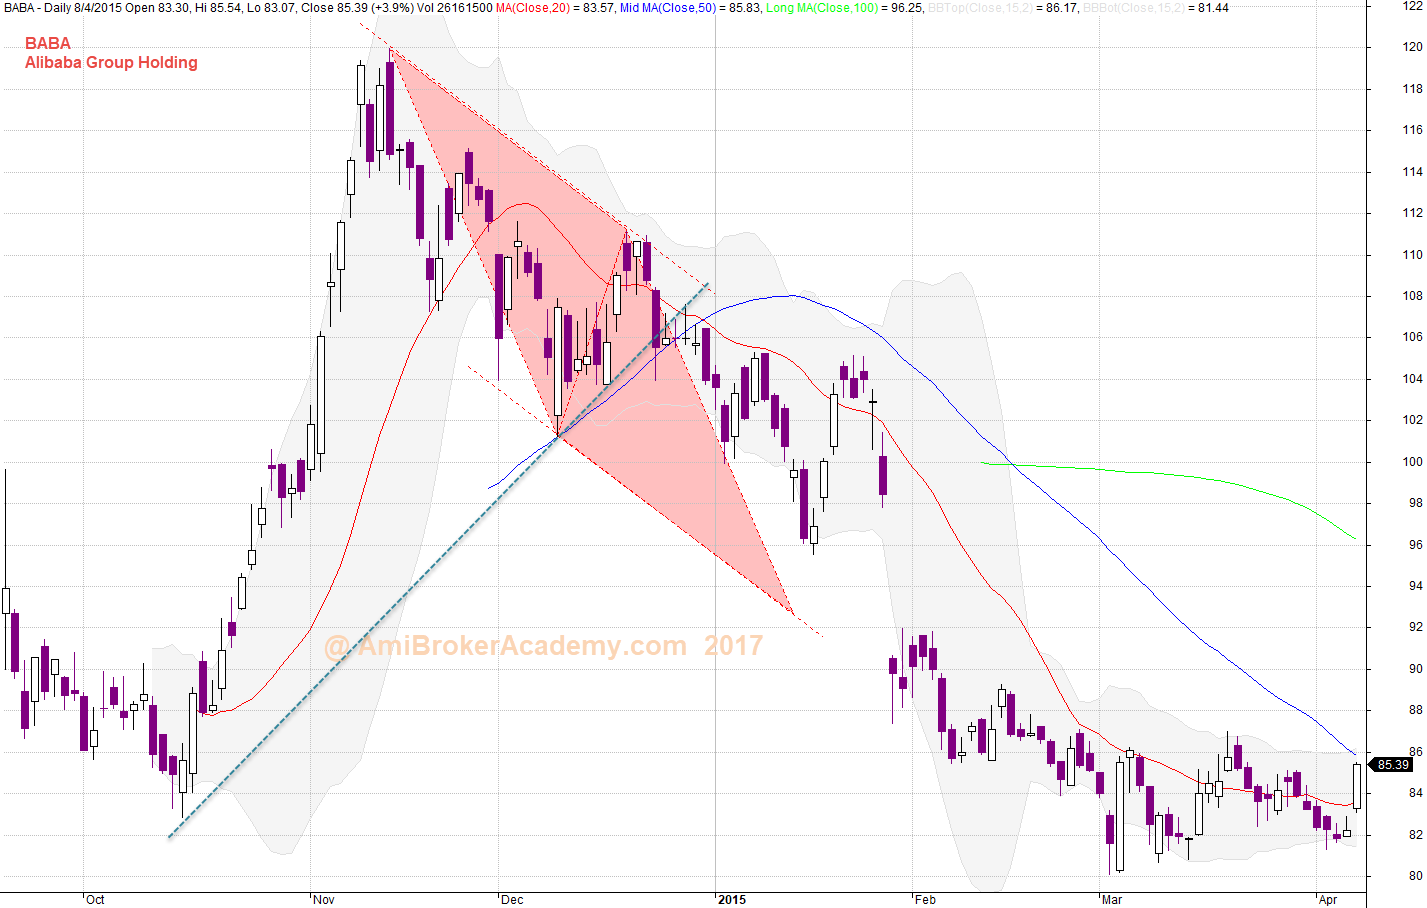
When We Look Back See the Results
Picture worth a thousand words. See chart for more.

Lesson: Gartley 222 ABCD Pattern, Alibaba Chart Analysis
Moses Stock Analysis
AmiBrokerAcademy.com
DISCLAIMER
Stock trading is not a get rich quick scheme and it is high risk.
Information provided here is of the nature of a general comment only and no intend to be specific for trading advice. It has prepared without regard to any particular investment objectives, financial situation or needs. Information should NOT be considered as an offer or enticement to buy, sell or trade.
You should seek advice from your broker, or licensed investment advisor, before taking any action.
Once again, the website does not guarantee any results or investment return based on the information and instruction you have read here. It should be used as learning aids.
Trading is personal. You are responsible for your own trading decision.
The comment is the author personal experience. There is no intent for your believe and follow.
