August 17, 2014
I Find the Right One at the Wrong Time, Moses’ Stock Column
Welcome to Moses’ Stock Column at AmiBrokerAcademy.com. Thank you for visiting the site. One of the reasons you are here because you want to know who moves your stock.
Lesson
I Find the Right One at the Wrong Time
Many have great experience in receiving excellent investment or trading advice, the so called tips on what to trade. One common thread in the best of this great tips is why you always end up lost.
Because many fail to ask what is the timeframe for that particular advice. The same stock on the same period, buy or sell both will make money. As the stock is not static, if you buy the stock when it is raising and takes profit when it starts to decline. You win. Likewise, it is true when you sell when the stock is on decline and buy back when the direction change. Again you profit.
So, one advice is you take responsibility for your own trade. You analyse, evaluate the risk before you trade. Do not jump the gun.
Of course there are people they are so lucky, they always enter the market at the right time and ride the wave.
So don’t play play. Do your home work and trade responsibly.
Moses’ Free MACD Scan
This site provides you the free MACD scan for Singapore stocks.
This is August 7, 2014, Thursday Singapore stocks that have the following MACD signals, which have trading volume greater than 500,000 shares.
Total 55 stocks have MACD bullish and bearish signals, 14 stocks have bullish MACD signals, and 33 stocks have bearish MACD signals.
Only 25 stocks are traded more than 500,000 shares. Only 12 stocks have bullish MACD signals, and 13 stocks have bearish MACD signals.
- MACD line crosses above MACD signal – Bullish trend
- MACD line crosses above zero line – Bullish trend
- MACD Histogram +ve Divergence – Bullish trend
- MACD line crosses below MACD signal – Bearish trend
- MACD line crosses below zero line – Bearish trend
- MACD Histogram -ve Divergence – Bearish trend
- Volume traded greater 500,000 shares
| Ticker | Company | Signals | Close | Vol.(K) | Screening Result |
| Y92 | THAI BEVERAGE PUBLIC CO LTD | Buy | 0.635 | 46874 | MACD Cross-Up Signal |
| BS6 | YANGZIJIANG SHIPBLDG HLDGS LTD | Buy | 1.115 | 18472 | MACD Cross-Up Signal |
| B9S | COSMOSTEEL HOLDINGS LIMITED | Buy | 0.44 | 10151 | MACD Cross-Up Signal |
| A50 | ROWSLEY LTD. | Buy | 0.235 | 7894 | MACD Cross-Up Signal |
| Z59 | YOMA STRATEGIC HOLDINGS LTD | Buy | 0.675 | 4461 | MACD-H +ve Divergence |
| 5OU | CHINA ENVIRONMENT LTD. | Buy | 0.25 | 2476 | MACD Cross-Up Signal |
| KJ5 | BBR HOLDINGS (S) LTD | Buy | 0.295 | 1490 | MACD Cross-Up Signal |
| 5UX | OXLEY HOLDINGS LIMITED | Buy | 0.645 | 1064 | MACD-H +ve Divergence |
| C8R | JIUTIAN CHEMICAL GROUP LIMITED | Buy | 0.066 | 1030 | MACD-H +ve Divergence |
| 5IM | GMG GLOBAL LTD | Buy | 0.083 | 871 | MACD-H +ve Divergence |
| ER0 | KSH HOLDINGS LIMITED | Buy | 0.54 | 738 | MACD-H +ve Divergence |
| TQ5 | FRASERS CENTREPOINT LIMITED | Buy | 1.775 | 654 | MACD Cross-Up Signal |
| G13 | GENTING SINGAPORE PLC | Sell | 1.31 | 24390 | MACD Cross-Down ZeroLine |
| D05 | DBS GROUP HOLDINGS LTD | Sell | 18.14 | 4848 | MACD Cross-Down Signal |
| S08 | SINGAPORE POST LIMITED | Sell | 1.76 | 4836 | MACD-H -ve Divergence |
| S63 | SINGAPORE TECH ENGINEERING LTD | Sell | 3.77 | 4445 | MACD Cross-Down ZeroLine |
| 5UE | SHC CAPITAL ASIA LIMITED | Sell | 0.335 | 2331 | MACD-H -ve Divergence |
| CC3 | STARHUB LTD | Sell | 4.14 | 2166 | MACD Cross-Down ZeroLine |
| 5HH | SINJIA LAND LIMITED | Sell | 0.225 | 2088 | MACD Cross-Down Signal |
| A7S | SUNVIC CHEMICAL HOLDINGS LTD | Sell | 0.49 | 1728 | MACD Cross-Down Signal |
| SK7 | OUE HOSPITALITY TRUST | Sell | 0.9 | 1490 | MACD Cross-Down Signal |
| I12 | IPC CORPORATION LIMITED | Sell | 0.146 | 1488 | MACD Cross-Down Signal |
| A26 | SINARMAS LAND LIMITED | Sell | 0.625 | 1269 | MACD Cross-Down ZeroLine |
| 5TG | 800 SUPER HOLDINGS LIMITED | Sell | 0.245 | 1109 | MACD Cross-Down ZeroLine |
| L19 | LUM CHANG HOLDINGS LIMITED | Sell | 0.375 | 820 | MACD Cross-Down ZeroLine |
Straits Times Index
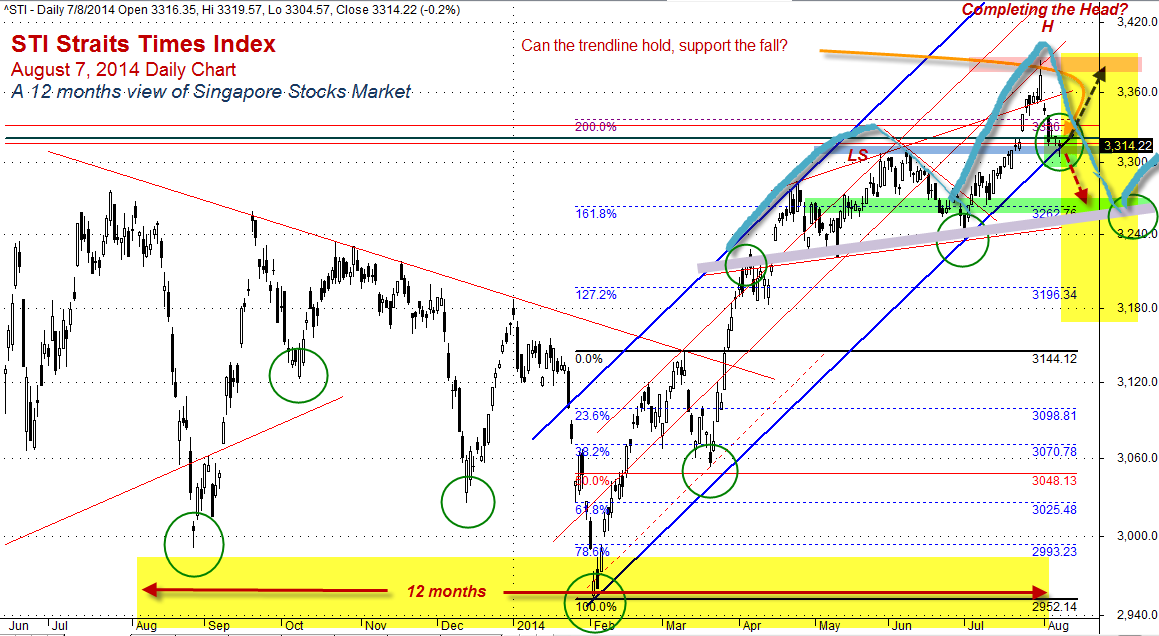
August 7, 2014, Thursday Straits Times Index, STI closed at 3314.22 points. STI gaps down another 6.01points from the last closed 3320.23 points .
STI has been on the decline since July 31, 2014.
.
Thanks for visiting the site, AmiBrokerAcademy.com.
Moses
DISCLAIMER
Information provided here is of the nature of a general comment only and no intend to be specific for trading advice. It has prepared without regard to any particular investment objectives, financial situation or needs. Information should not be considered as an offer or enticement to buy, sell or trade.
You should seek advice from your broker, or licensed investment advisor, before taking any action.
Once again, the website does not guarantee any results or investment return based on the information and instruction you have read here. It should be used as learning aids only and if you decide to trade real money, all trading decision should be your own.

