Thanks for visiting the site, amibrokeracademy.com.
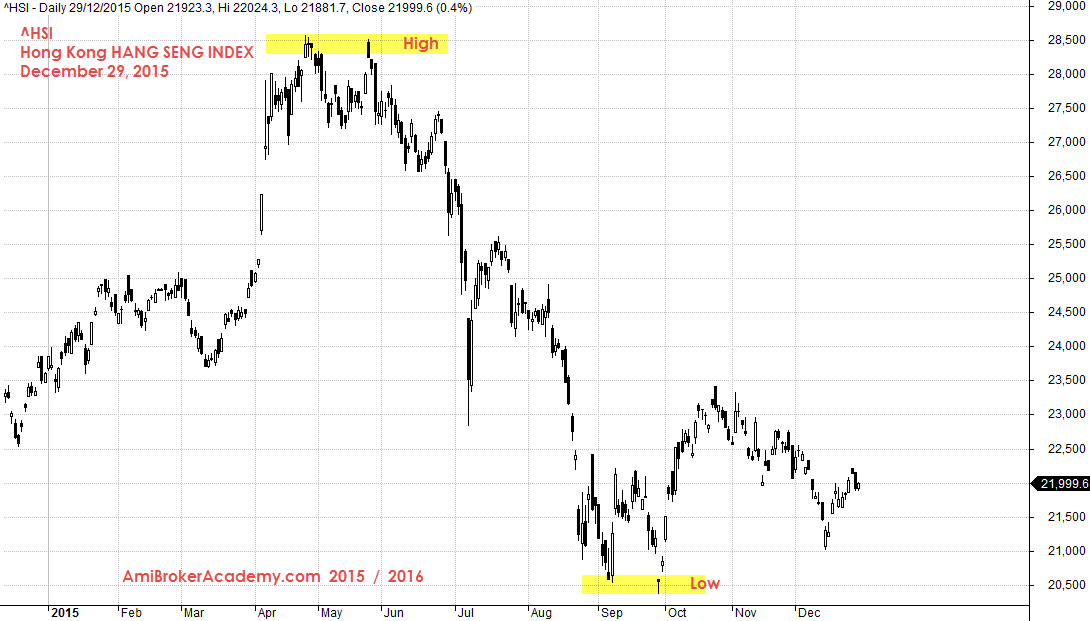
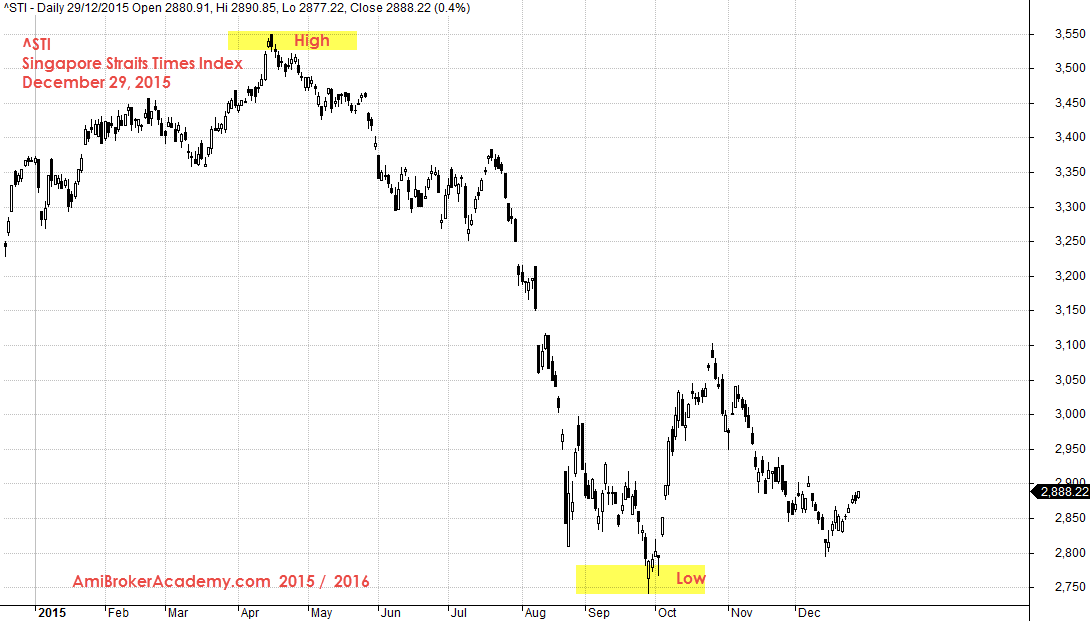
Two more days to go, we will complete the 2015. Can the last two days of trading turn the whole market around? Well, can, but unlikely. If this is the case, the following charts show you the Hong Kong and Singapore stock market performance for 2015.
Picture worth a thousand words. If you do not look at them closely, from far the two charts are quite alike.
But, if you will look at two years data the picture will be vast different. Hope this help?
Hong Kong Stock Index – Hang Seng Index

December 29, 2015 Hong Kong Hang Seng Index
Singapore Stock Index – Straits Times Index

December 29, 2015 Straits Times Index
Compare the Two Years Data, 2014 and 2015
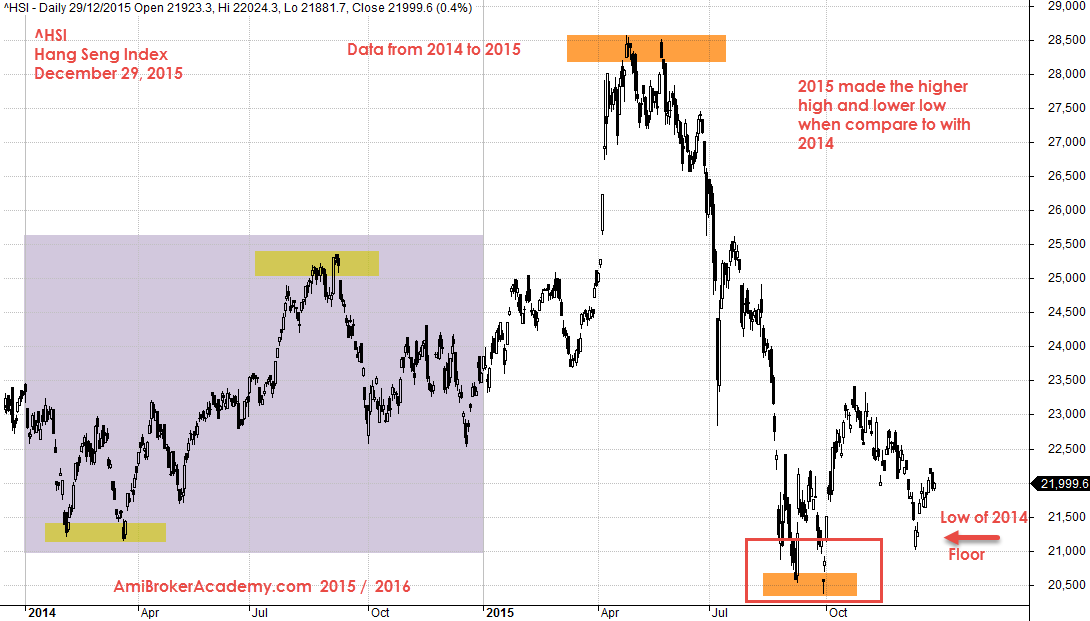
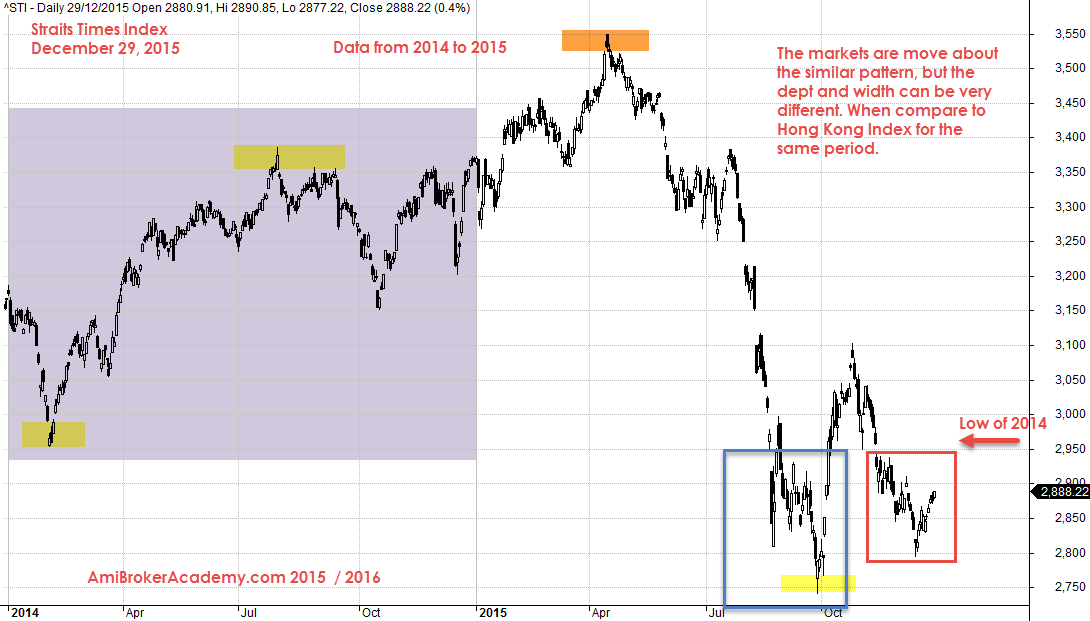
Take a step back, if you will compare two years data of these two market, Hong Kong and Singapore. You will find a great different. Although the move is above the same.
Hong Kong Index
2015 has greater volatility as compare to 2014, picture worth a thousand words.

December 29, 2015 Hang Seng Index Two Years Data from 2014
Singapore Stocks Index

December 29, 2015 Two Years Straits Times Index
Moses Stocks Analysis and Scan
Disclaimer: All information, data and material contained, presented, or provided on amibrokeracademy.com is for educational purposes only. It is not to be construed or intended as providing trading or legal advice. Decisions you make about your trading or investment are important to you and your family, therefore should be made in consultation with a competent financial advisor or professional. We are not financial advisor and do not claim to be. Any views expressed here-in are not necessarily those held by amibrokeracademy.com. You are responsible for your trade decision and wealth being.
