8 November 2016
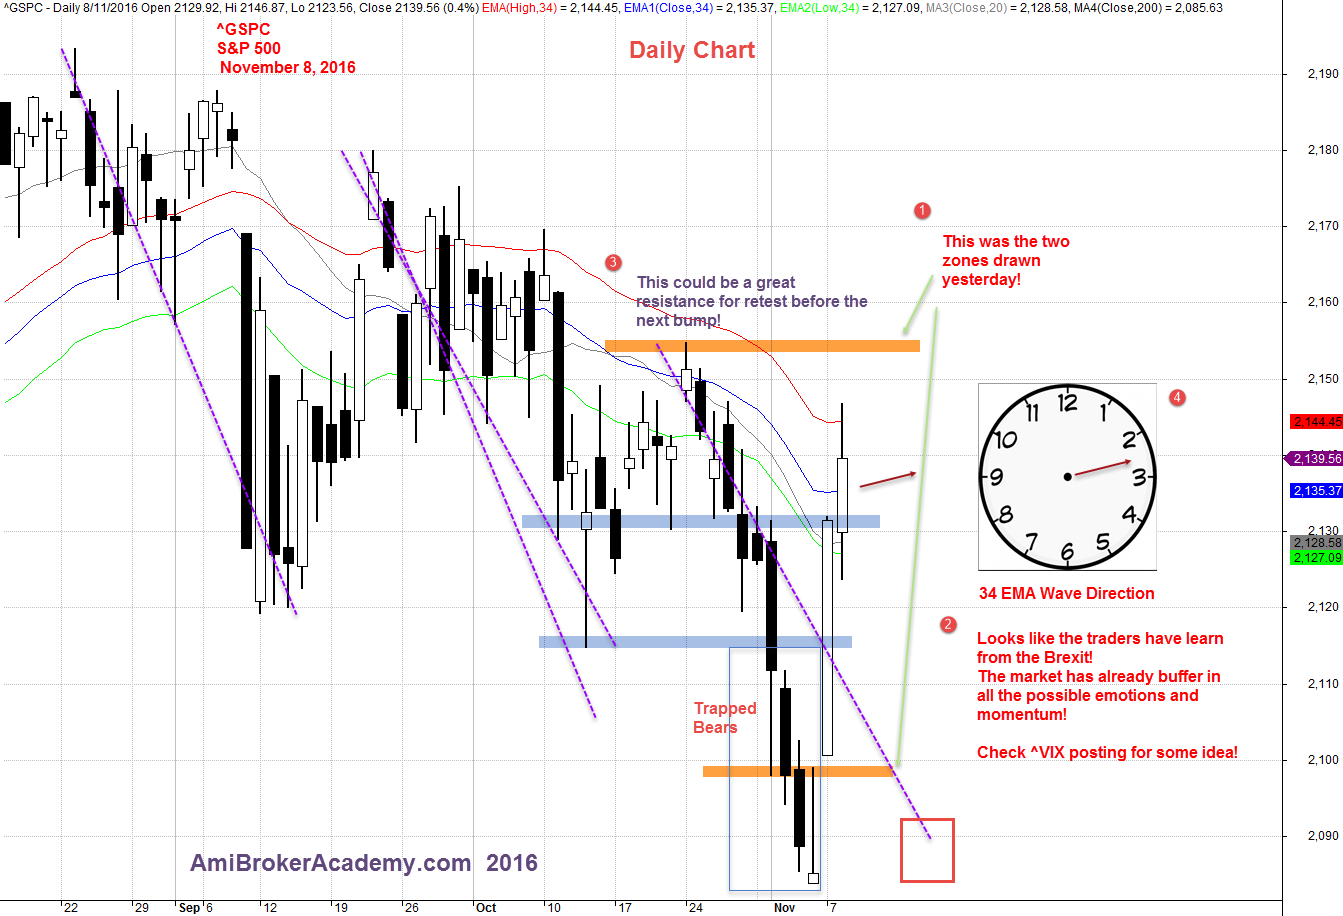
We see an ABCD buy chart pattern. S&P 500 open gap up and close higher. An ABCD Buy Chart Pattern, see chart for more.
We were worry will 34 EMA Wave become the new resistance for the S&P 500 Index bounce. We have asked you to watch the space here. See chart for November 8, market sentiment.
^GSPC | S&P 500 Stop the Two Weeks Fall and Pullback | Wow! Pullback Continue
The market probably have learnt from Brexit, the price action has done enough to prepare for a bounce. Will see.
Look at the bullish bar, has two long tails, and long body. The bulls and bears has a good fight. But bulls are stronger. Be aware, the bears are ready to come back.

November 8, 2016 S&P 500 Index Daily and 34 EMA Wave
Have fun!
Moses US Stock Desk
AmiBrokerAcademy.com
Disclaimer: All information, data and material contained, presented, or provided on amibrokeracademy.com is for educational purposes only. It is not to be construed or intended as providing trading or legal advice. Decisions you make about your trading or investment are important to you and your family, therefore should be made in consultation with a competent financial advisor or professional. We are not financial advisor and do not claim to be. Any views expressed here-in are not necessarily those held by amibrokeracademy.com. You are responsible for your trade decision and wealth being.
