30 April, 2018
Thank you for visiting the site. Hope you like the content.
Why Use Program to Scan the DB?
Do you know why we use a program or script to scan the entire database for stock that have MACD bullish or bearish signals? I believe you probably have read many discussion about robotic, automation and so on. This is what the automation is all about when you use the script or program to scan the database for bullish or bearish signals. It only take less than fifteen minutes to scan through nearly eight thousands US stocks.
Even with the bullish or bearish signals, the stock may take many days or weeks to really move. Of course all setup may fail. So, some of the bullish or bearish may not come true.
Image without the program or script, it is probably take days or weeks to read the chart by chart, or stock by stock.
Besides US Bank Index Not Bearish It’s True For Japan Index Too
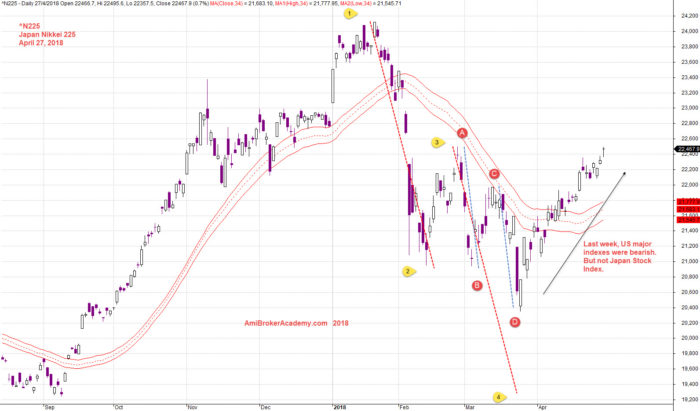
We saw majority of US stock indexes were bearish. But not for the bank index. Now, we see Japan stock index alos not bearish for last week. See chart below for more. Manage your risk.

April 27, 2018 Japan Nikkei 225 Index and MA Wave
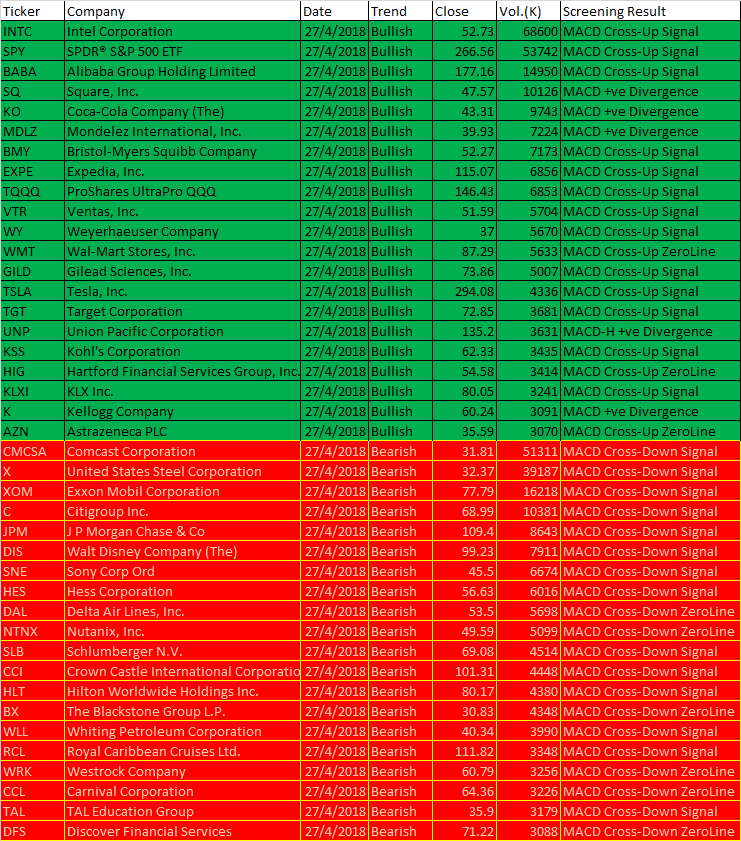
Free MACD Scan One-day US Stock MACD Screening Results on April 27 2018
Remember all setup can fail. This is true for all indicators. It is also true for MACD signals setup. See some of the MACD setup fail examples on this website.

April 27, 2018 US Stock MACD One-day Scan Results
These are the six types of MACD Signals:
- MACD line crosses above MACD signal – Bullish trend
- MACD line crosses above zero line – Bullish trend
- MACD Histogram +ve Divergence – Bullish trend
- MACD line crosses below MACD signal – Bearish trend
- MACD line crosses below zero line – Bearish trend
- MACD Histogram -ve Divergence – Bearish trend
| Ticker | Company | Date | Trend | Close | Vol.(K) | Screening Result |
| INTC | Intel Corporation | 27/4/2018 | Bullish | 52.73 | 68600 | MACD Cross-Up Signal |
| SPY | SPDR® S&P 500 ETF | 27/4/2018 | Bullish | 266.56 | 53742 | MACD Cross-Up Signal |
| BABA | Alibaba Group Holding Limited | 27/4/2018 | Bullish | 177.16 | 14950 | MACD Cross-Up Signal |
| SQ | Square, Inc. | 27/4/2018 | Bullish | 47.57 | 10126 | MACD +ve Divergence |
| KO | Coca-Cola Company (The) | 27/4/2018 | Bullish | 43.31 | 9743 | MACD +ve Divergence |
| MDLZ | Mondelez International, Inc. | 27/4/2018 | Bullish | 39.93 | 7224 | MACD +ve Divergence |
| BMY | Bristol-Myers Squibb Company | 27/4/2018 | Bullish | 52.27 | 7173 | MACD Cross-Up Signal |
| EXPE | Expedia, Inc. | 27/4/2018 | Bullish | 115.07 | 6856 | MACD Cross-Up Signal |
| TQQQ | ProShares UltraPro QQQ | 27/4/2018 | Bullish | 146.43 | 6853 | MACD Cross-Up Signal |
| VTR | Ventas, Inc. | 27/4/2018 | Bullish | 51.59 | 5704 | MACD Cross-Up Signal |
| WY | Weyerhaeuser Company | 27/4/2018 | Bullish | 37 | 5670 | MACD Cross-Up Signal |
| WMT | Wal-Mart Stores, Inc. | 27/4/2018 | Bullish | 87.29 | 5633 | MACD Cross-Up ZeroLine |
| GILD | Gilead Sciences, Inc. | 27/4/2018 | Bullish | 73.86 | 5007 | MACD Cross-Up Signal |
| TSLA | Tesla, Inc. | 27/4/2018 | Bullish | 294.08 | 4336 | MACD Cross-Up Signal |
| TGT | Target Corporation | 27/4/2018 | Bullish | 72.85 | 3681 | MACD Cross-Up Signal |
| UNP | Union Pacific Corporation | 27/4/2018 | Bullish | 135.2 | 3631 | MACD-H +ve Divergence |
| KSS | Kohl’s Corporation | 27/4/2018 | Bullish | 62.33 | 3435 | MACD Cross-Up Signal |
| HIG | Hartford Financial Services Group, Inc. (The) | 27/4/2018 | Bullish | 54.58 | 3414 | MACD Cross-Up ZeroLine |
| KLXI | KLX Inc. | 27/4/2018 | Bullish | 80.05 | 3241 | MACD Cross-Up Signal |
| K | Kellogg Company | 27/4/2018 | Bullish | 60.24 | 3091 | MACD +ve Divergence |
| AZN | Astrazeneca PLC | 27/4/2018 | Bullish | 35.59 | 3070 | MACD Cross-Up ZeroLine |
| CMCSA | Comcast Corporation | 27/4/2018 | Bearish | 31.81 | 51311 | MACD Cross-Down Signal |
| X | United States Steel Corporation | 27/4/2018 | Bearish | 32.37 | 39187 | MACD Cross-Down Signal |
| XOM | Exxon Mobil Corporation | 27/4/2018 | Bearish | 77.79 | 16218 | MACD Cross-Down Signal |
| C | Citigroup Inc. | 27/4/2018 | Bearish | 68.99 | 10381 | MACD Cross-Down Signal |
| JPM | J P Morgan Chase & Co | 27/4/2018 | Bearish | 109.4 | 8643 | MACD Cross-Down Signal |
| DIS | Walt Disney Company (The) | 27/4/2018 | Bearish | 99.23 | 7911 | MACD Cross-Down Signal |
| SNE | Sony Corp Ord | 27/4/2018 | Bearish | 45.5 | 6674 | MACD Cross-Down Signal |
| HES | Hess Corporation | 27/4/2018 | Bearish | 56.63 | 6016 | MACD Cross-Down Signal |
| DAL | Delta Air Lines, Inc. | 27/4/2018 | Bearish | 53.5 | 5698 | MACD Cross-Down ZeroLine |
| NTNX | Nutanix, Inc. | 27/4/2018 | Bearish | 49.59 | 5099 | MACD Cross-Down ZeroLine |
| SLB | Schlumberger N.V. | 27/4/2018 | Bearish | 69.08 | 4514 | MACD Cross-Down Signal |
| CCI | Crown Castle International Corporation | 27/4/2018 | Bearish | 101.31 | 4448 | MACD Cross-Down Signal |
| HLT | Hilton Worldwide Holdings Inc. | 27/4/2018 | Bearish | 80.17 | 4380 | MACD Cross-Down Signal |
| BX | The Blackstone Group L.P. | 27/4/2018 | Bearish | 30.83 | 4348 | MACD Cross-Down ZeroLine |
| WLL | Whiting Petroleum Corporation | 27/4/2018 | Bearish | 40.34 | 3990 | MACD Cross-Down Signal |
| RCL | Royal Caribbean Cruises Ltd. | 27/4/2018 | Bearish | 111.82 | 3348 | MACD Cross-Down Signal |
| WRK | Westrock Company | 27/4/2018 | Bearish | 60.79 | 3256 | MACD Cross-Down ZeroLine |
| CCL | Carnival Corporation | 27/4/2018 | Bearish | 64.36 | 3226 | MACD Cross-Down ZeroLine |
| TAL | TAL Education Group | 27/4/2018 | Bearish | 35.9 | 3179 | MACD Cross-Down Signal |
| DFS | Discover Financial Services | 27/4/2018 | Bearish | 71.22 | 3088 | MACD Cross-Down ZeroLine |
Have fun! Reader must understand what MACD is all about before using the results.
Moses US Stock Scan
AmiBroker Academy.com
Disclaimer:
The above result is for illustration purpose. It is not meant to be used for buy or sell decision. We do not recommend any particular stocks. If particular stocks of such are mentioned, they are meant as demonstration of Amibroker as a powerful charting software and MACD. Amibroker can program to scan the stocks for buy and sell signals.
These are script generated signals. Not all scan results are shown here. The MACD signal should use with price action. Users must understand what MACD and price action are all about before using them. If necessary you should attend a course to learn more on Technical Analysis (TA) and Moving Average Convergence Divergence, MACD.
Once again, the website does not guarantee any results or investment return based on the information and instruction you have read here. It should be used as learning aids only and if you decide to trade real money, all trading decision should be your own.
