30 April, 2018
Thank you for visiting the site. Hope you like the content.
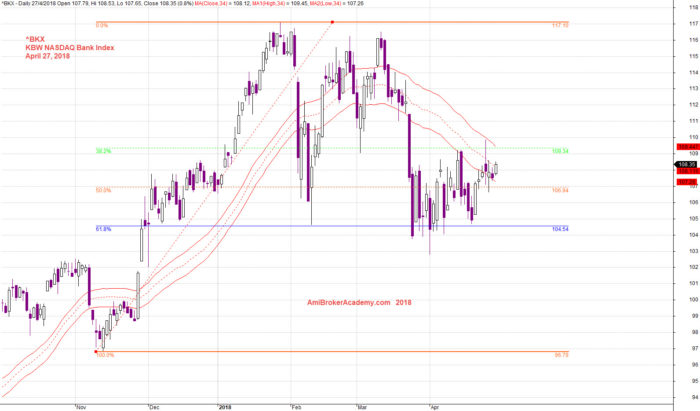
Not Bearish for Bank Index
We saw majority of US stock indexes were bearish. But not for the bank index. See chart below for more. Manage your risk.

April 27, 2018 KBW NASDAQ Bank Index and Fibo Retracement Low to High
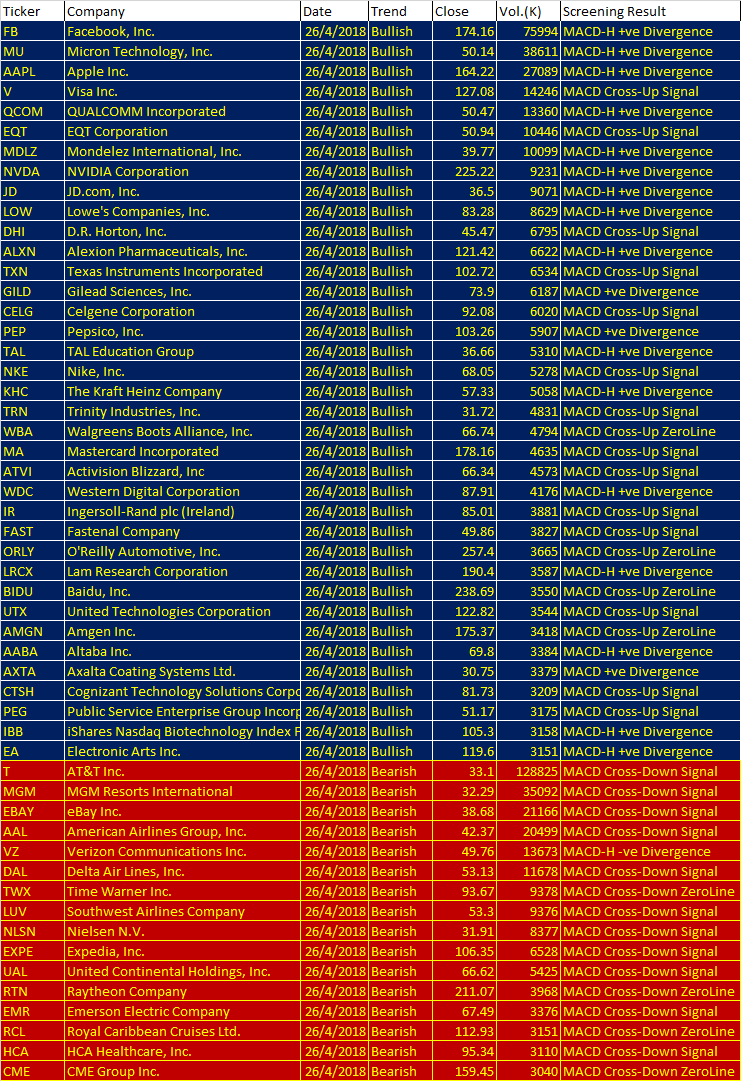
Free MACD Scan One-day US Stock MACD Screening Results on April 26 2018
Remember all setup can fail. This is true for all indicators. It is also true for MACD signals setup. See some of the MACD setup fail examples on this website.

April 26, 2018 US Stock One-day MACD Scan Signals
These are the six types of MACD Signals:
- MACD line crosses above MACD signal – Bullish trend
- MACD line crosses above zero line – Bullish trend
- MACD Histogram +ve Divergence – Bullish trend
- MACD line crosses below MACD signal – Bearish trend
- MACD line crosses below zero line – Bearish trend
- MACD Histogram -ve Divergence – Bearish trend
| Ticker | Company | Date | Trend | Close | Vol.(K) | Screening Result |
| FB | Facebook, Inc. | 26/4/2018 | Bullish | 174.16 | 75994 | MACD-H +ve Divergence |
| MU | Micron Technology, Inc. | 26/4/2018 | Bullish | 50.14 | 38611 | MACD-H +ve Divergence |
| AAPL | Apple Inc. | 26/4/2018 | Bullish | 164.22 | 27089 | MACD-H +ve Divergence |
| V | Visa Inc. | 26/4/2018 | Bullish | 127.08 | 14246 | MACD Cross-Up Signal |
| QCOM | QUALCOMM Incorporated | 26/4/2018 | Bullish | 50.47 | 13360 | MACD-H +ve Divergence |
| EQT | EQT Corporation | 26/4/2018 | Bullish | 50.94 | 10446 | MACD Cross-Up Signal |
| MDLZ | Mondelez International, Inc. | 26/4/2018 | Bullish | 39.77 | 10099 | MACD-H +ve Divergence |
| NVDA | NVIDIA Corporation | 26/4/2018 | Bullish | 225.22 | 9231 | MACD-H +ve Divergence |
| JD | JD.com, Inc. | 26/4/2018 | Bullish | 36.5 | 9071 | MACD-H +ve Divergence |
| LOW | Lowe’s Companies, Inc. | 26/4/2018 | Bullish | 83.28 | 8629 | MACD-H +ve Divergence |
| DHI | D.R. Horton, Inc. | 26/4/2018 | Bullish | 45.47 | 6795 | MACD Cross-Up Signal |
| ALXN | Alexion Pharmaceuticals, Inc. | 26/4/2018 | Bullish | 121.42 | 6622 | MACD-H +ve Divergence |
| TXN | Texas Instruments Incorporated | 26/4/2018 | Bullish | 102.72 | 6534 | MACD Cross-Up Signal |
| GILD | Gilead Sciences, Inc. | 26/4/2018 | Bullish | 73.9 | 6187 | MACD +ve Divergence |
| CELG | Celgene Corporation | 26/4/2018 | Bullish | 92.08 | 6020 | MACD Cross-Up Signal |
| PEP | Pepsico, Inc. | 26/4/2018 | Bullish | 103.26 | 5907 | MACD +ve Divergence |
| TAL | TAL Education Group | 26/4/2018 | Bullish | 36.66 | 5310 | MACD-H +ve Divergence |
| NKE | Nike, Inc. | 26/4/2018 | Bullish | 68.05 | 5278 | MACD Cross-Up Signal |
| KHC | The Kraft Heinz Company | 26/4/2018 | Bullish | 57.33 | 5058 | MACD-H +ve Divergence |
| TRN | Trinity Industries, Inc. | 26/4/2018 | Bullish | 31.72 | 4831 | MACD Cross-Up Signal |
| WBA | Walgreens Boots Alliance, Inc. | 26/4/2018 | Bullish | 66.74 | 4794 | MACD Cross-Up ZeroLine |
| MA | Mastercard Incorporated | 26/4/2018 | Bullish | 178.16 | 4635 | MACD Cross-Up Signal |
| ATVI | Activision Blizzard, Inc | 26/4/2018 | Bullish | 66.34 | 4573 | MACD Cross-Up Signal |
| WDC | Western Digital Corporation | 26/4/2018 | Bullish | 87.91 | 4176 | MACD-H +ve Divergence |
| IR | Ingersoll-Rand plc (Ireland) | 26/4/2018 | Bullish | 85.01 | 3881 | MACD Cross-Up Signal |
| FAST | Fastenal Company | 26/4/2018 | Bullish | 49.86 | 3827 | MACD Cross-Up Signal |
| ORLY | O’Reilly Automotive, Inc. | 26/4/2018 | Bullish | 257.4 | 3665 | MACD Cross-Up ZeroLine |
| LRCX | Lam Research Corporation | 26/4/2018 | Bullish | 190.4 | 3587 | MACD-H +ve Divergence |
| BIDU | Baidu, Inc. | 26/4/2018 | Bullish | 238.69 | 3550 | MACD Cross-Up ZeroLine |
| UTX | United Technologies Corporation | 26/4/2018 | Bullish | 122.82 | 3544 | MACD Cross-Up Signal |
| AMGN | Amgen Inc. | 26/4/2018 | Bullish | 175.37 | 3418 | MACD Cross-Up ZeroLine |
| AABA | Altaba Inc. | 26/4/2018 | Bullish | 69.8 | 3384 | MACD-H +ve Divergence |
| AXTA | Axalta Coating Systems Ltd. | 26/4/2018 | Bullish | 30.75 | 3379 | MACD +ve Divergence |
| CTSH | Cognizant Technology Solutions Corporation | 26/4/2018 | Bullish | 81.73 | 3209 | MACD Cross-Up Signal |
| PEG | Public Service Enterprise Group Incorporated | 26/4/2018 | Bullish | 51.17 | 3175 | MACD Cross-Up Signal |
| IBB | iShares Nasdaq Biotechnology Index Fund | 26/4/2018 | Bullish | 105.3 | 3158 | MACD-H +ve Divergence |
| EA | Electronic Arts Inc. | 26/4/2018 | Bullish | 119.6 | 3151 | MACD-H +ve Divergence |
| T | AT&T Inc. | 26/4/2018 | Bearish | 33.1 | 128825 | MACD Cross-Down Signal |
| MGM | MGM Resorts International | 26/4/2018 | Bearish | 32.29 | 35092 | MACD Cross-Down Signal |
| EBAY | eBay Inc. | 26/4/2018 | Bearish | 38.68 | 21166 | MACD Cross-Down Signal |
| AAL | American Airlines Group, Inc. | 26/4/2018 | Bearish | 42.37 | 20499 | MACD Cross-Down Signal |
| VZ | Verizon Communications Inc. | 26/4/2018 | Bearish | 49.76 | 13673 | MACD-H -ve Divergence |
| DAL | Delta Air Lines, Inc. | 26/4/2018 | Bearish | 53.13 | 11678 | MACD Cross-Down Signal |
| TWX | Time Warner Inc. | 26/4/2018 | Bearish | 93.67 | 9378 | MACD Cross-Down ZeroLine |
| LUV | Southwest Airlines Company | 26/4/2018 | Bearish | 53.3 | 9376 | MACD Cross-Down Signal |
| NLSN | Nielsen N.V. | 26/4/2018 | Bearish | 31.91 | 8377 | MACD Cross-Down Signal |
| EXPE | Expedia, Inc. | 26/4/2018 | Bearish | 106.35 | 6528 | MACD Cross-Down Signal |
| UAL | United Continental Holdings, Inc. | 26/4/2018 | Bearish | 66.62 | 5425 | MACD Cross-Down Signal |
| RTN | Raytheon Company | 26/4/2018 | Bearish | 211.07 | 3968 | MACD Cross-Down ZeroLine |
| EMR | Emerson Electric Company | 26/4/2018 | Bearish | 67.49 | 3376 | MACD Cross-Down Signal |
| RCL | Royal Caribbean Cruises Ltd. | 26/4/2018 | Bearish | 112.93 | 3151 | MACD Cross-Down ZeroLine |
| HCA | HCA Healthcare, Inc. | 26/4/2018 | Bearish | 95.34 | 3110 | MACD Cross-Down Signal |
| CME | CME Group Inc. | 26/4/2018 | Bearish | 159.45 | 3040 | MACD Cross-Down ZeroLine |
Have fun! Reader must understand what MACD is all about before using the results.
Moses US Stock Scan
AmiBroker Academy.com
Disclaimer:
The above result is for illustration purpose. It is not meant to be used for buy or sell decision. We do not recommend any particular stocks. If particular stocks of such are mentioned, they are meant as demonstration of Amibroker as a powerful charting software and MACD. Amibroker can program to scan the stocks for buy and sell signals.
These are script generated signals. Not all scan results are shown here. The MACD signal should use with price action. Users must understand what MACD and price action are all about before using them. If necessary you should attend a course to learn more on Technical Analysis (TA) and Moving Average Convergence Divergence, MACD.
Once again, the website does not guarantee any results or investment return based on the information and instruction you have read here. It should be used as learning aids only and if you decide to trade real money, all trading decision should be your own.
