5 December, 2018
Think think got more things.
Yesterday, Lianhe Zaobao has an article covering Singapore tech stocks, 科技制造业小型股净利股价大多下跌. From the title, the tone was quite negative. Picture worth a thousand words, we shall study these tech stocks chart and see how these stocks performance, I mean stock price. One experience was invest in high tech company is risky. Simple rules of thumb, high investment, and subject to market direction. Many of these organization are difficult in recovering their investment. Next, as high tech, the investment can not stop to chase after the technology. Technology is outdated every moment. The worst part is invest into wrong technology, the investment got no return.
See some of the great stock in US, Google and Amazon. They are not high tech company, but using high tech in their business. … Can you see the different? Today, no one can stay away from using technology, but a technology company to see technology products are different.
Think, think. Just memory, the memory use in your personal company, or portable devices. At one point, the memory was a great business, next the memory become less demand as the market demand has switch from computer to phone. And the technology obsolete fast, when you to sell withing six months, you could scrap the product. Think. So, put your money on technology, you have to bang on the right time. Very important the right time. Fast in, fast out. … Think think again.
Remember, no right no wrong. We see thing from different perspective. You could have very good experience. But, but you are just lucky. Some of the great company in Europe on phone, you could see the come back is still not within sight. Not just one, a few. In US, the great name of a mobile phone, and you could hardly hear them now. They try a new product, and yet catch on.
To think ahead of technology and stay a head in the demand is not an easy task.
Thanks for visiting the site.
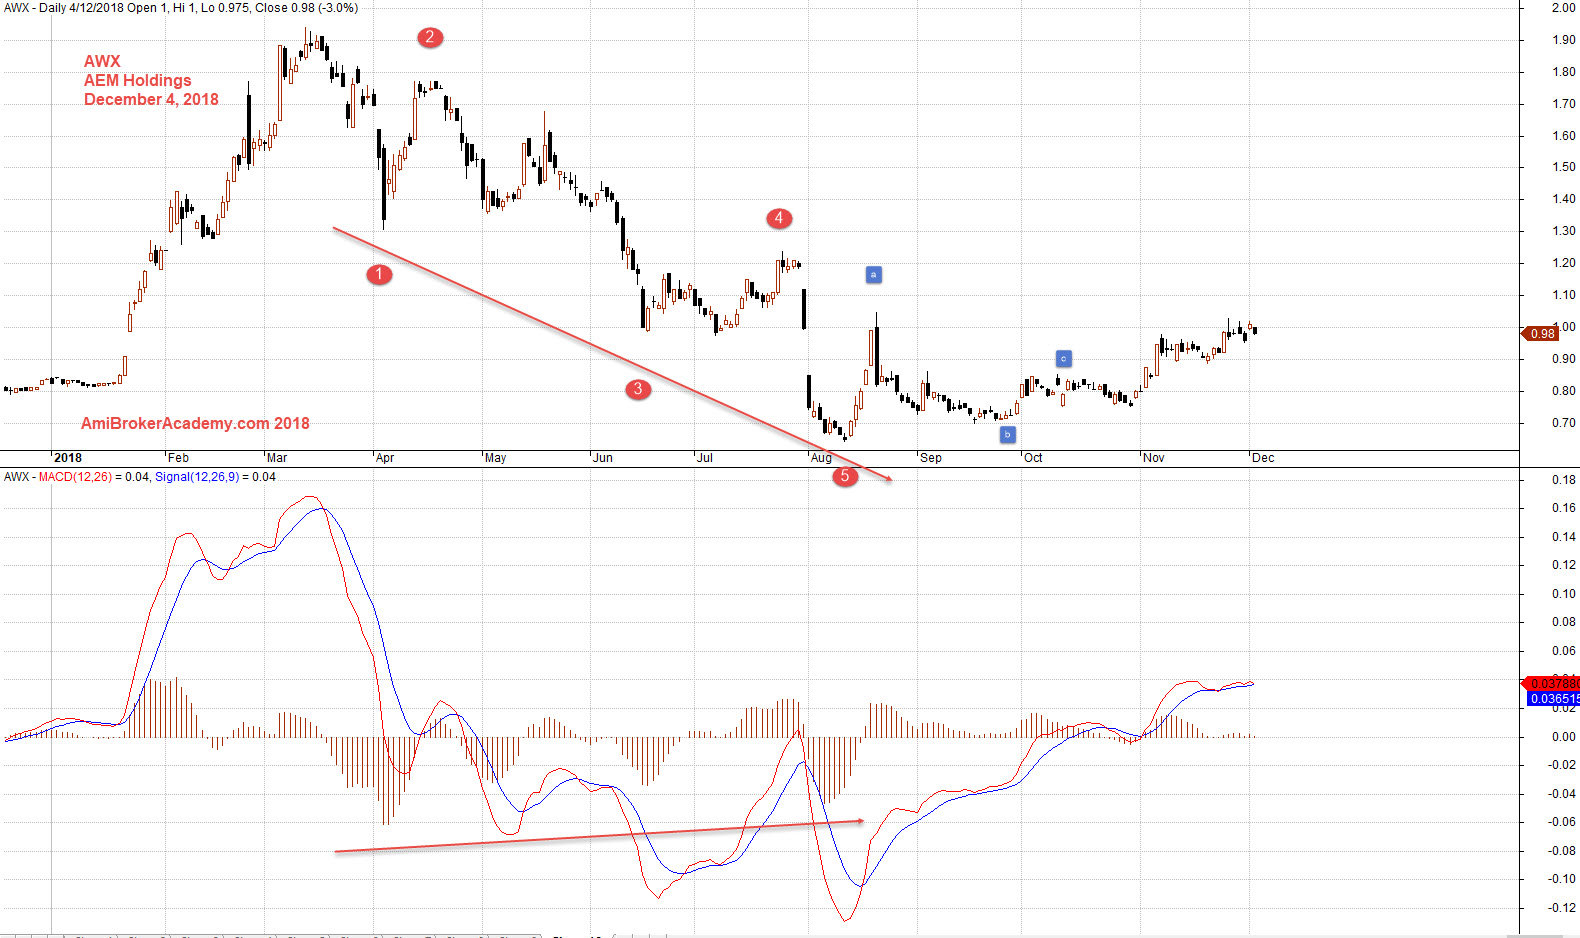
Study the down moment, you could easily make out the five waves down; Elliot Wave.
AWX AEM Holdings Charting
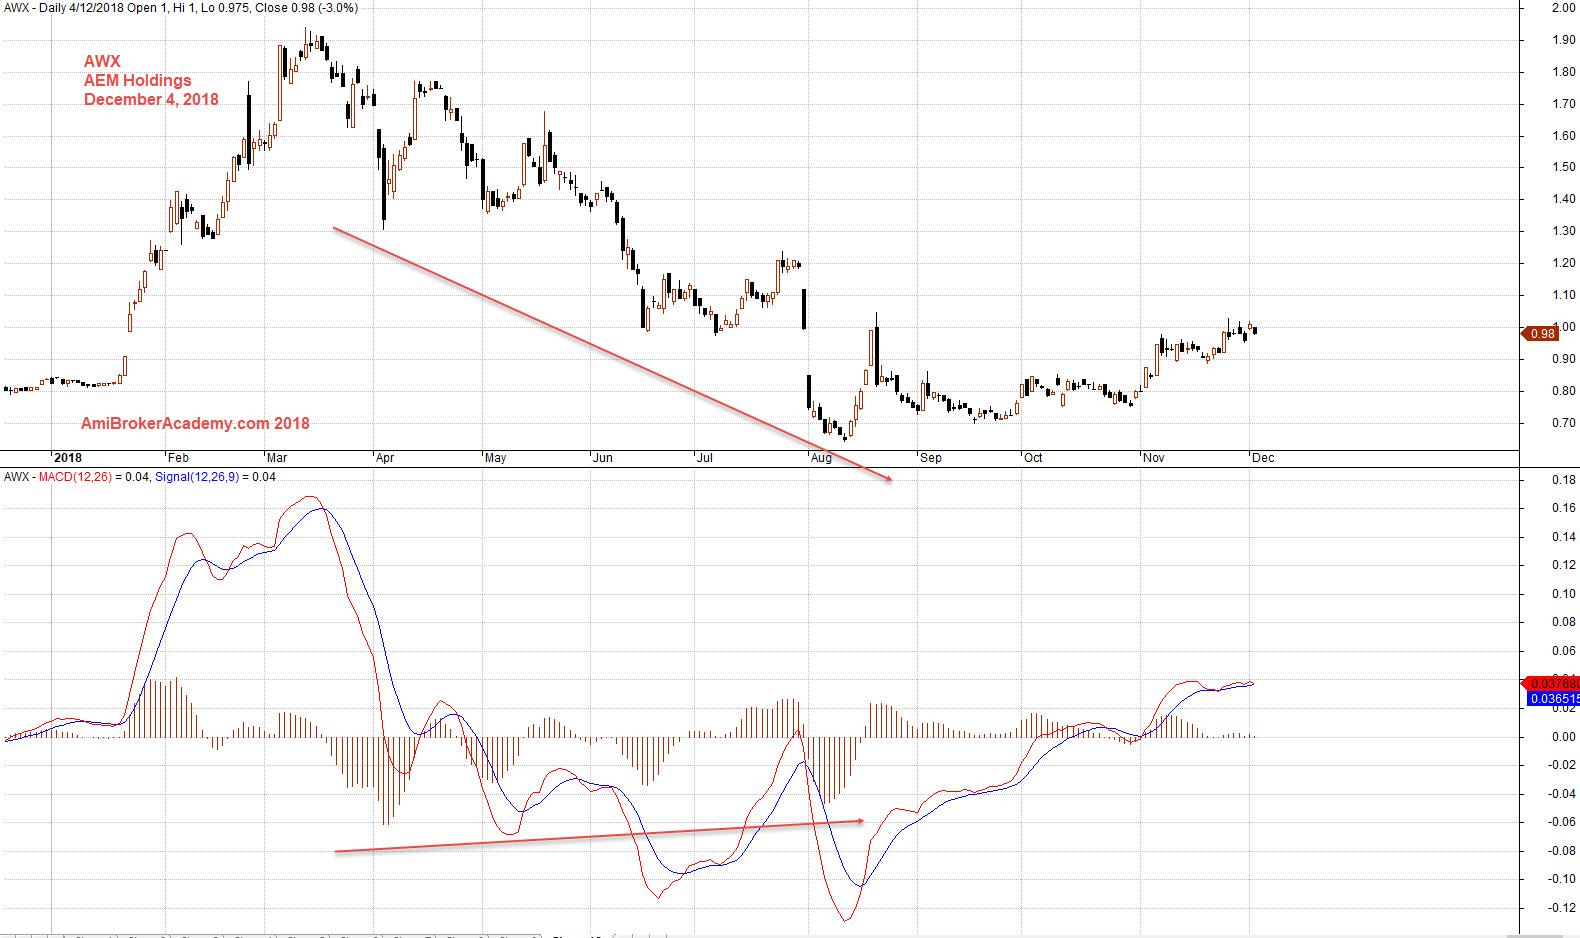
Study the chart using MACD indicator, see chart, price continue to move lower, from chart you could see the price goes lower than 80 cents, last December stock price. The market has bet on the stock price to reverse. But very slow.
Trade with your eyes open.

December 4, 2018 AEM Holdings and MACD
if you can see the full chart, “press Ctrl and -” to zoom out and see the entire chart.
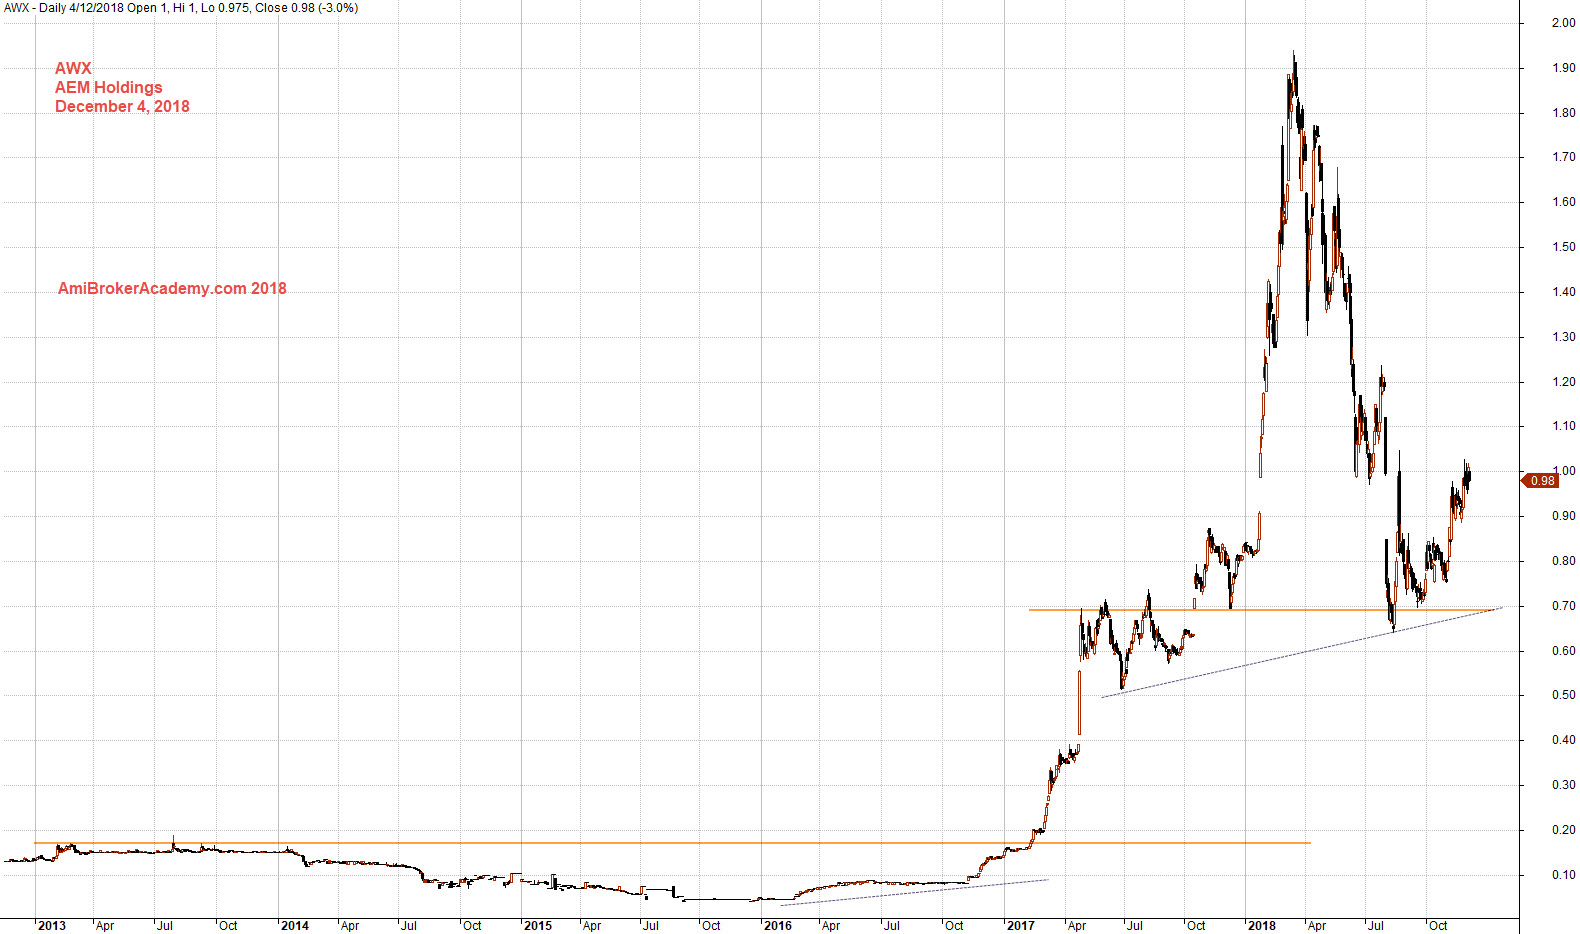
Zoom out, zoom out to see the stock back from 2013. Imagine you were the supporter, you apply the BHS, Buy Hold Strategy. You will be happy, the price back then was resisted near 20 cents, and today the stock price is near one dollars. Of course, if you were lucky to take profit when the price action is near two dollars. You will actually say, you see don’t any how buy stock, you must buy the potential one, the technology stock. Will see.
Let’s study a few other tech stocks listed in Singapore.
And do not forget to trade with your eyes open.

December 4, 2018 AEM Holdings Buy Hold Strategy
If you can not see the wave count, see chart below.

December 4, 2018 AEM Holdings and Elliot Wave
Moses US Stock Chart Analysis
AmiBrokerAcademy.com
Disclaimer
The above result is for illustration purpose. It is not meant to be used for buy or sell decision. We do not recommend any particular stocks. If particular stocks of such are mentioned, they are meant as demonstration of Amibroker as a powerful charting software and MACD. Amibroker can program to scan the stocks for buy and sell signals.
These are script generated signals. Not all scan results are shown here. The MACD signal should use with price action. Users must understand what MACD and price action are all about before using them. If necessary you should attend a course to learn more on Technical Analysis (TA) and Moving Average Convergence Divergence, MACD.
Once again, the website does not guarantee any results or investment return based on the information and instruction you have read here. It should be used as learning aids only and if you decide to trade real money, all trading decision should be your own.
