July 8, 2016
Supply and Demand
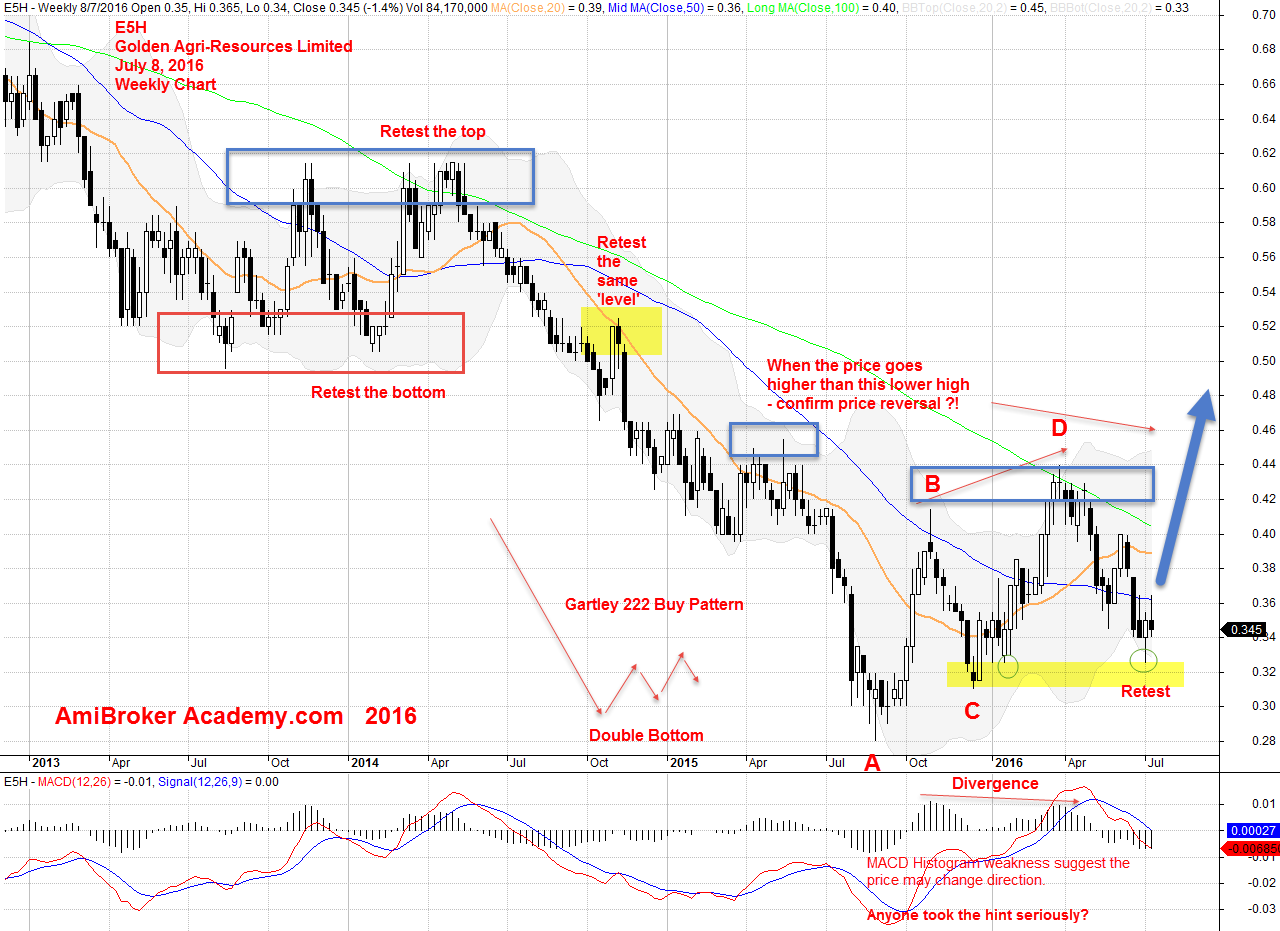
Is that a over supply of the palm products? Is there a link between the products and stock price? Whatever the answer you may debate, but one thing for sure, there is a no demand in stock and resulting the stock price keeps fall lower. In July 2015, the price has hit the low of 0.28. Anyone has pick bottom, catch the falling knife? Can the price move to 0.48? If the three drive up will continue.
Gartley 222 will be effective, when near top or bottom. Assume, 0.28 is the bottom until it proven wrong; the price goes below 0.28.
MACD is an leading indicator. If you have see the chart and monitor the MACD Histogram divergence. You will not be surprised of the price move lower after point D.

July 8, 2016 Golden Agri Resources E5H Weekly Chart
You can read about the previous Golden Agri Resource stock analysis on this site. See link for details.
E5H | Moses Golden Agri Resources Stock Analysis
Trade What You See | Gartley 222 Sell Pattern | Golden Agri Resources
Three Drive Pattern | Golden Agri Resournce | Moses Singapore Stock Analysis
If you enjoy reading the post here. Please come back for more.
Thanks for visiting the site, you can find many other analysis and concepts on this site. Have fun!
Moses Stock Analysis and Scan
Disclaimer: All information, data and material contained, presented, or provided on amibrokeracademy.com is for educational purposes only. It is not to be construed or intended as providing trading or legal advice. Decisions you make about your trading or investment are important to you and your family, therefore should be made in consultation with a competent financial advisor or professional. We are not financial advisor and do not claim to be. Any views expressed here-in are not necessarily those held by amibrokeracademy.com. You are responsible for your trade decision and wealth being.
The site uses powerful charting software, AmiBroker charting software.
