November 30, 2017
Singapore Stock Analysis
Always Start With Big Picture Do Not Fire From Your Hip
Not What You Think
We are the strong believer on trading has never be easy. The success of a trade has many factors involved. Otherwise Warren Buffett will never be outstanding. There is “NO HOLY GRAIL” or may be has not been discovered so far.
Plan your trade, trade your plan. Easy said then done.
In order to be efficient in your analysis and planning. Using a light and powerful charting tool become essential. The following charts are produce from AmiBroker Chart Software. AmiBroker is one of the great and powerful charting software in the last ten years.
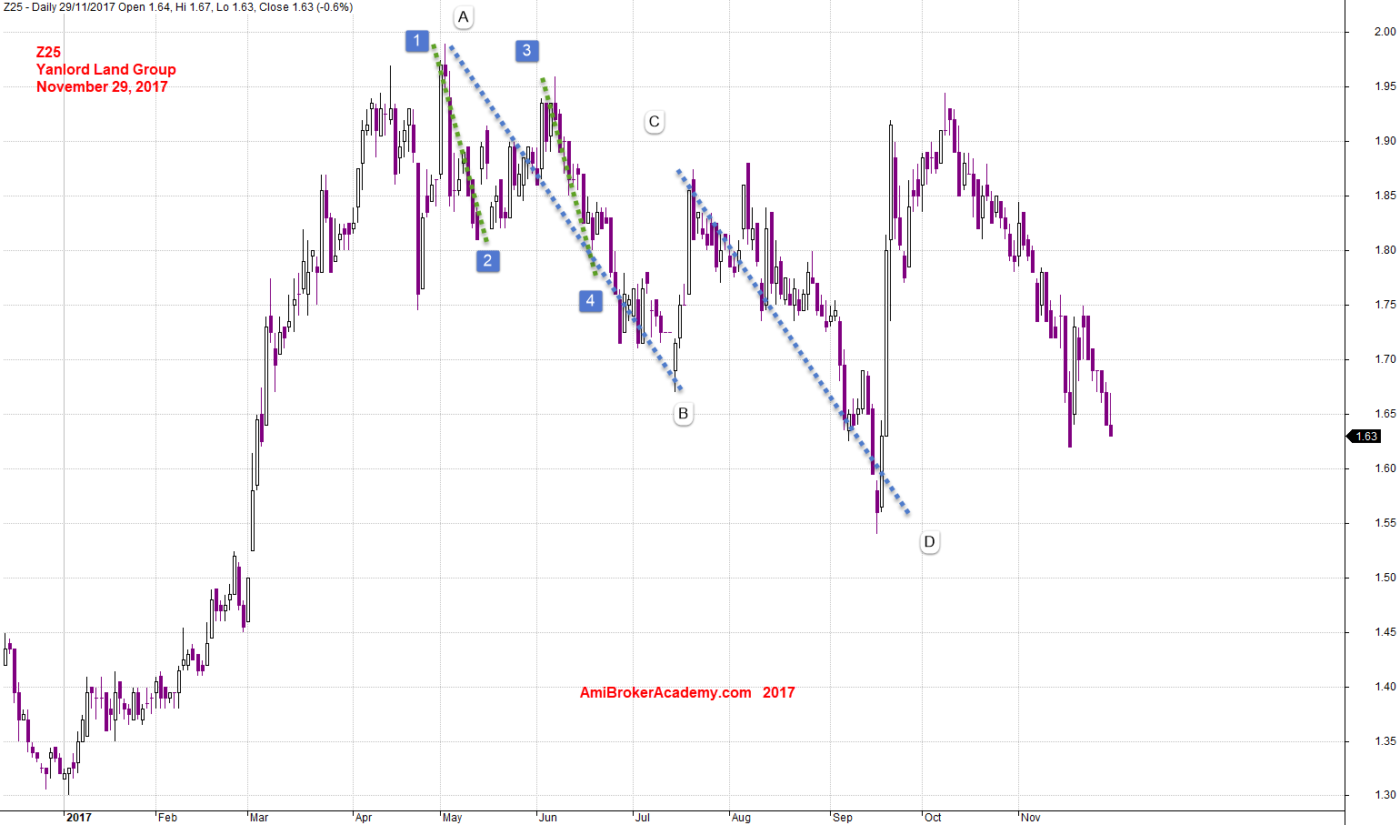
Z25 Yanlord Land Group and ABCD Pattern
You see trading has been not an easy task. It’s is not like everybody think (even some Gurus), why? See the chart below, from the big picture, you see a potential topping. The spike retest a few times. In between a few ABCD pattern.
Can you see the big ABCD pattern and the small ABCD pattern? The true, the stock price is always in zigzaq. In every ABCD pattern, there can have many smaller ABCD pattern. If you go lower timeframe, you could even find more.
The example here shown ABCD buy pattern, a small one, and a big one.

November 29, 2017 Yanlord Land Group and ABCD Pattern
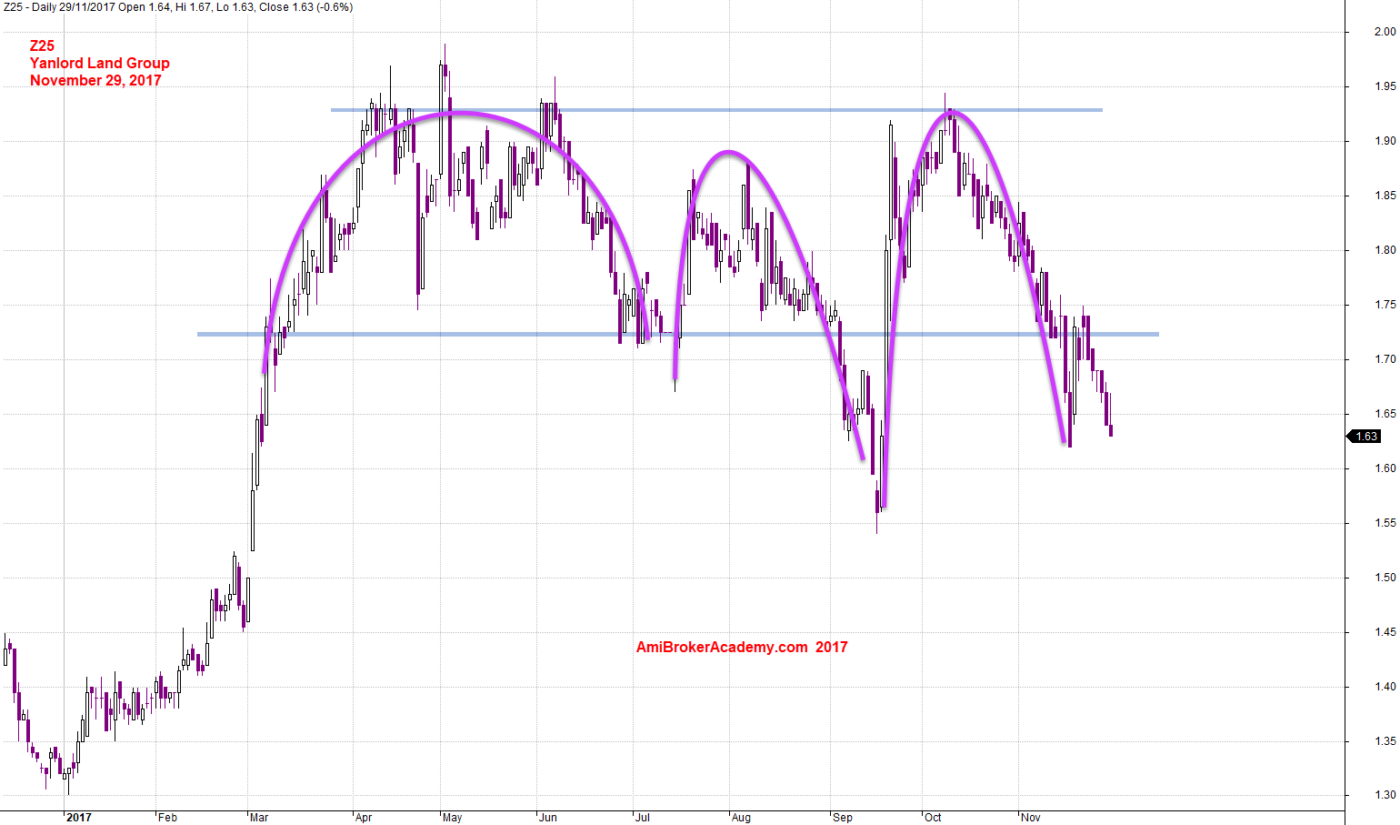
Z25 Yanlord Land Group and Support Resistance
Took the same chart, add the Support Resistance. The spike has been tested a few times. If you will trade breakout at near 1.90, 1.92 or so, you could be trapped when you buy up. In such the original bullish trend will you sell. You are likely to add more.
Candlestick does play an important role in trading, when you see a long tail; a group of trader taking profit, some new traders do not think the price is worth it. Soon the bearish trend will happen. Of course there time this is not happening. That is why, we said it is not what you think and it is how you think.

November 29, 2017 Yanlord Land Group and Support Resistance
Moses
AmiBrokerAcademy.com
Disclaimer
The above result is for illustration purpose. It is not meant to be used for buy or sell decision. We do not recommend any particular stocks. If particular stocks of such are mentioned, they are meant as demonstration of Amibroker as a powerful charting software and MACD. Amibroker can program to scan the stocks for buy and sell signals.
These are script generated signals. Not all scan results are shown here. The MACD signal should use with price action. Users must understand what MACD and price action are all about before using them. If necessary you should attend a course to learn more on Technical Analysis (TA) and Moving Average Convergence Divergence, MACD.
Once again, the website does not guarantee any results or investment return based on the information and instruction you have read here. It should be used as learning aids only and if you decide to trade real money, all trading decision should be your own.
