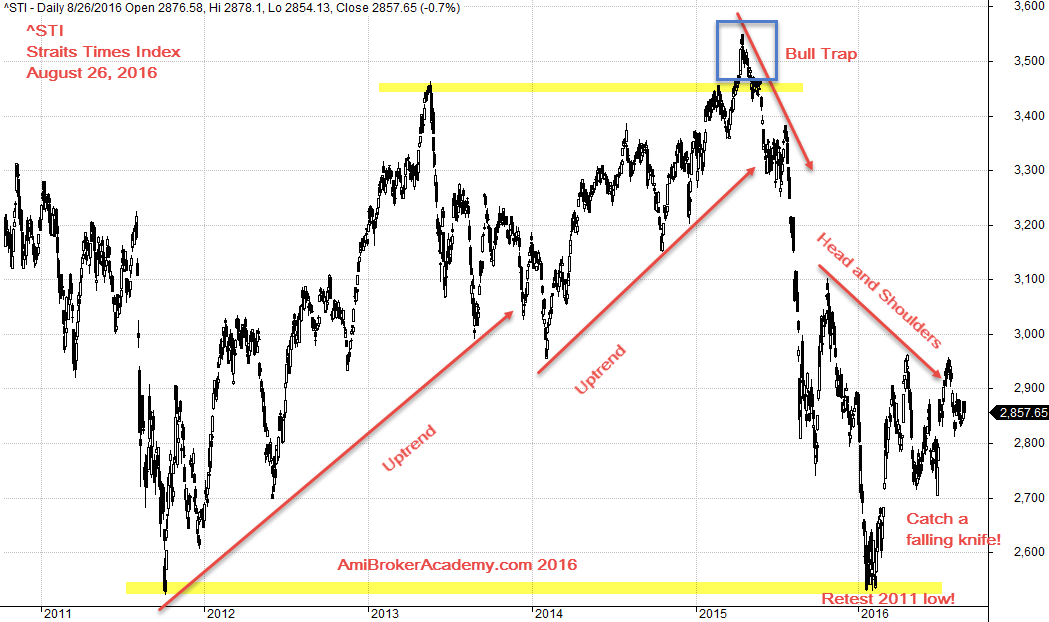
In 2015, Singapore stock market is one of the worst performance, read story from the link, http://sbr.com.sg/stocks/news/singapore-stock-market-one-asia%E2%80%99s-worst-performers-in-2015-report, and story from https://sg.finance.yahoo.com/news/singapore-stock-market-one-asia-230900552.html. We attribute the poor performance because of the oil price decline. What about 2016?
2016, so far from the data and chart compile by Lian He Zao Bao, Singapore is one of the worst among Asian countries, read story from link, http://www.zaobao.com.sg/finance/singapore/story20160827-659154.
Chart Worth a Thousand Words
Look at the time between the two lows, about the same level is five years. In between, there were two peaks. So if you like to catch the falling knife, you will need some patient; if the cycle is correct. The next same low will be another five years. In between there may be two peaks too.
If you have the holding power, may be you can try. Good luck. Have fun!
Straits Times Index Daily Since 2011

August 26, 2016 Straits Times Index Since 2011
Moses Stock Analysis
AmiBrokerAcademy.com
Disclaimer: All information, data and material contained, presented, or provided on amibrokeracademy.com is for educational purposes only. It is not to be construed or intended as providing trading or legal advice. Decisions you make about your trading or investment are important to you and your family, therefore should be made in consultation with a competent financial advisor or professional. We are not financial advisor and do not claim to be. Any views expressed here-in are not necessarily those held by amibrokeracademy.com. You are responsible for your trade decision and wealth being.
