July 1, 2018
Thanks for visiting the site.
Moses Stock Analysis – Trade with Eyes Open
Brazil Stock Market BOVESPA Index Charting
To learn how to trade, is first to understand the signals given from the chart.
The market can only in two direction, either up or down. When the market is not moving in up or down, the market will move in sideways. Now watch the market.
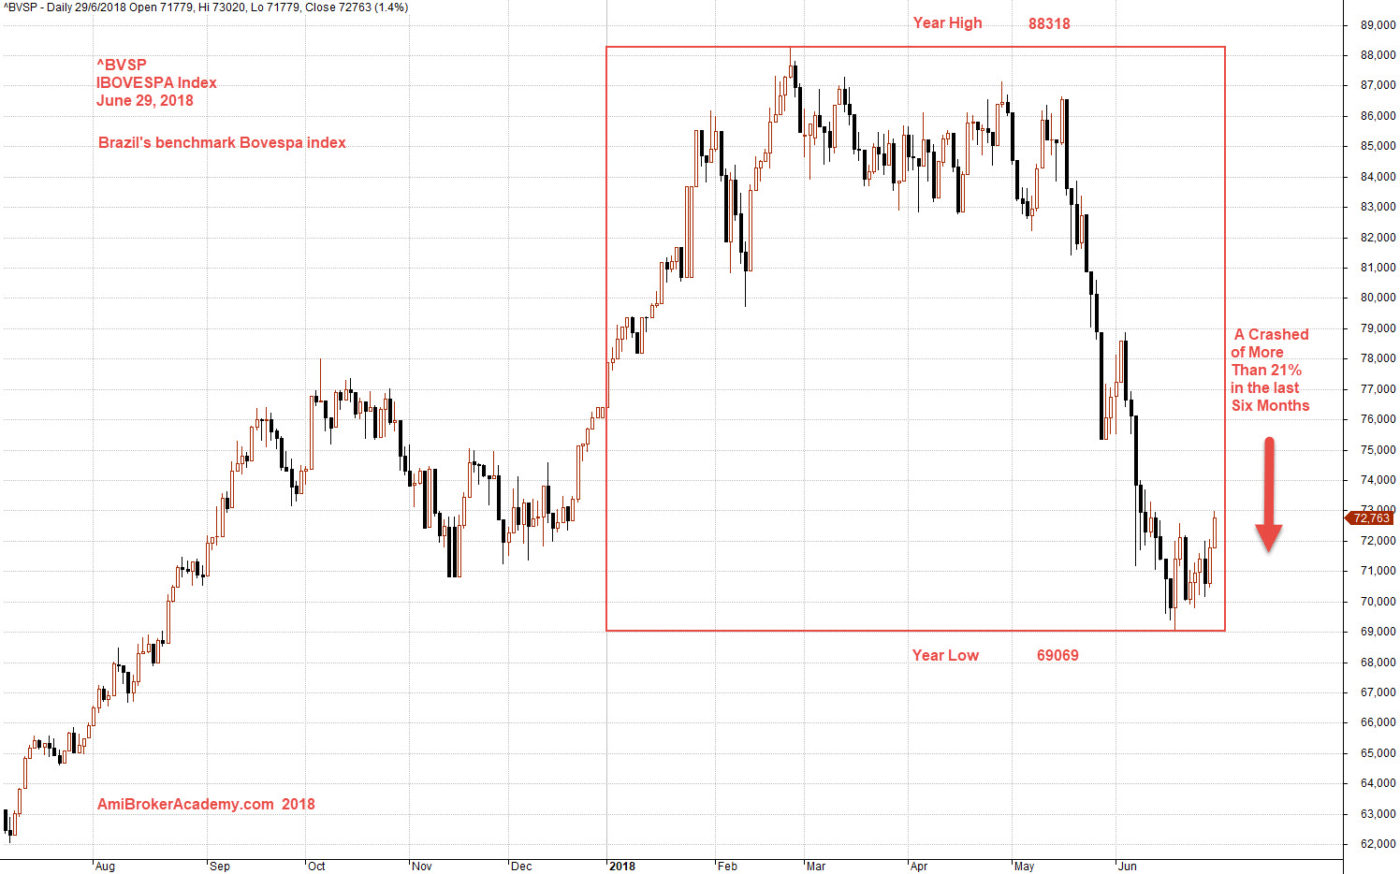
Box is a very useful tool, see we use the box to bound the 2018 market price action. See the year high and year low, from the box it is very easy to see the Brazil stock market has crashed from the high of 88318 level to the low of 69069. A tool drop of more than 21%.
If you will look back from our past analysis, we saw China market has a crashed or more than 20%, Hong Kong market a decline of more than 15%, and Singapore market a decline of more than 10 percent. What has happened to the trader and markets? A simple understanding is lack of buying mode. Then why? The traders do not think the market is good, or another way is lack of confident or weak in confident.
If you are checking the news regularly, you properly will agree the whole world are busy in thinking how to survive in the new U.S. tariff policy. Even the U.S. companies on the U.S. land are affected by the new tariff policy. As their cost of operation, products are affected. Many has lost their business, as a results the companies are reduction in production and work force.
In the basic economy, country reduce currency to encourage export, reduce corporate tax to attack foreign investment, for this case. For the company to survive is to reduce operations, reduce head counts. And for business is to use foreign materials, or foreign products. … Wow, too complicated for me. We only see all chart are pointing down.
Suggestion for your, either you stand aside and watch, or trade with high risk.
Manage your risk.

June 29, 2018 Brazil Stock Market BOVESPA Index and Year High Low
^BVSP Brazil Stock Market BOVESPA Index Charting
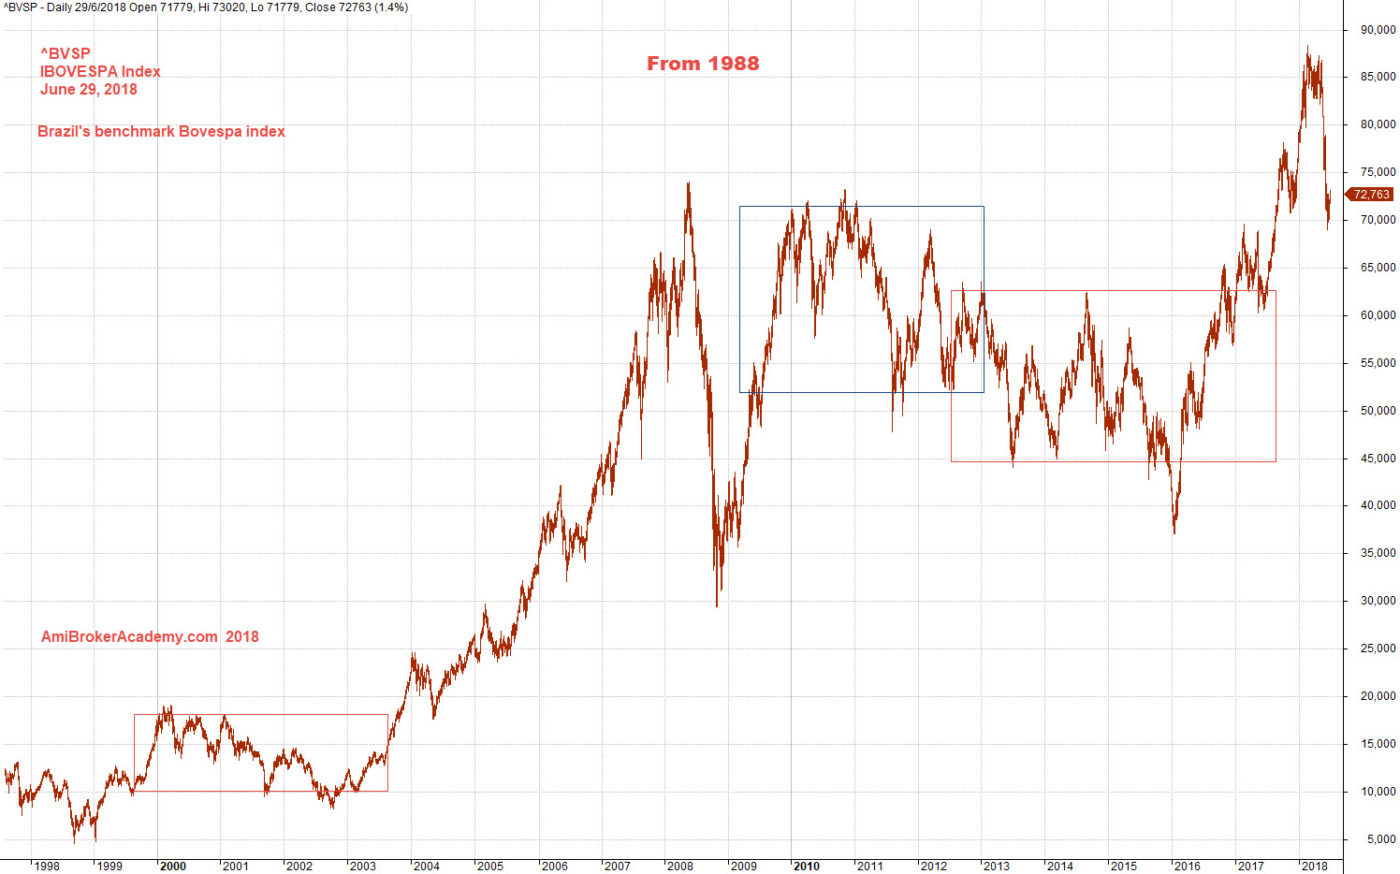
Picture worth a thousand words, see chart for Brazil Stock Market since 1988. Price action continue to be bullish from 2016. From the chart, the price action has crashed down below 2017 high. Test the 70,000 level, the 2010 high.
We use boxes to help to understand the price action and high low. Manage your risk.

June 29, 2018 Brazil Stock Market BOVESPA Index from 1988
Moses
AmiBrokerAcademy.com
Disclaimer
The above result is for illustration purpose. It is not meant to be used for buy or sell decision. We do not recommend any particular stocks. If particular stocks of such are mentioned, they are meant as demonstration of Amibroker as a powerful charting software and MACD. Amibroker can program to scan the stocks for buy and sell signals.
These are script generated signals. Not all scan results are shown here. The MACD signal should use with price action. Users must understand what MACD and price action are all about before using them. If necessary you should attend a course to learn more on Technical Analysis (TA) and Moving Average Convergence Divergence, MACD.
Once again, the website does not guarantee any results or investment return based on the information and instruction you have read here. It should be used as learning aids only and if you decide to trade real money, all trading decision should be your own.
