July 16, 2017
The Impossible
It has never been an easy task to trade and invest alongside to the economic forces and political forces that the markets is moving. Bluntly, it is almost impossible to achieve such success.
Understanding Limitations
You can reduce risk when you understand your limitations, at least you know there is risk.
Recognize Risk
Traders who recognize these risk can gain some advantage as they can be more realistic to view of their problem. Instead of believe that there is holy grail, can predict the market direction. At least these traders will spend time study the markets, and try to ride the waves.
Traders have to be humble in order to be successful in their trading or some are investing. The bottom line is trading is never ending a hard work and struggle.
Hard Work and Struggle
Trading is not an easy task, never an easy task. It is hard work and struggle to identifying the forces and the markets intend so you can ride the waves with the big players.
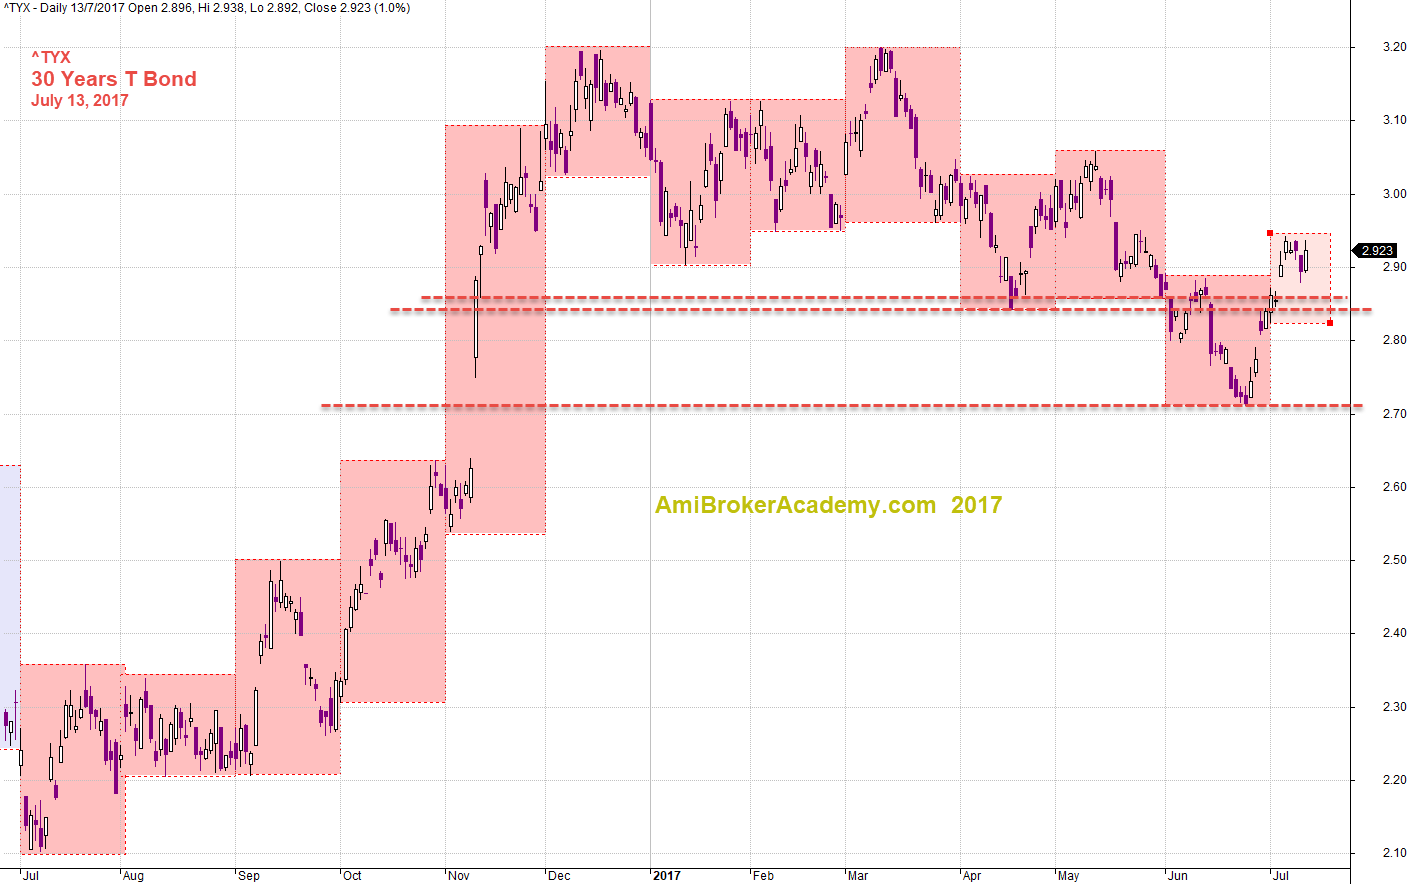
^TYX T Bond and Keys Support Resistance
Picture worth a thousand words. See chart for more information.
Many of the market or many countries are heavily influenced by the US Indexes such as Dow, S&P 100 and so on.
In additional to those Indexes, there are also thing that traders are watching in US market, Bond. There is always a correlation between bond and stock indexes.
The chart has showed some reversal, so can bond be the leading indicator? Will see.

July 13, 2017 T Bond and Levels
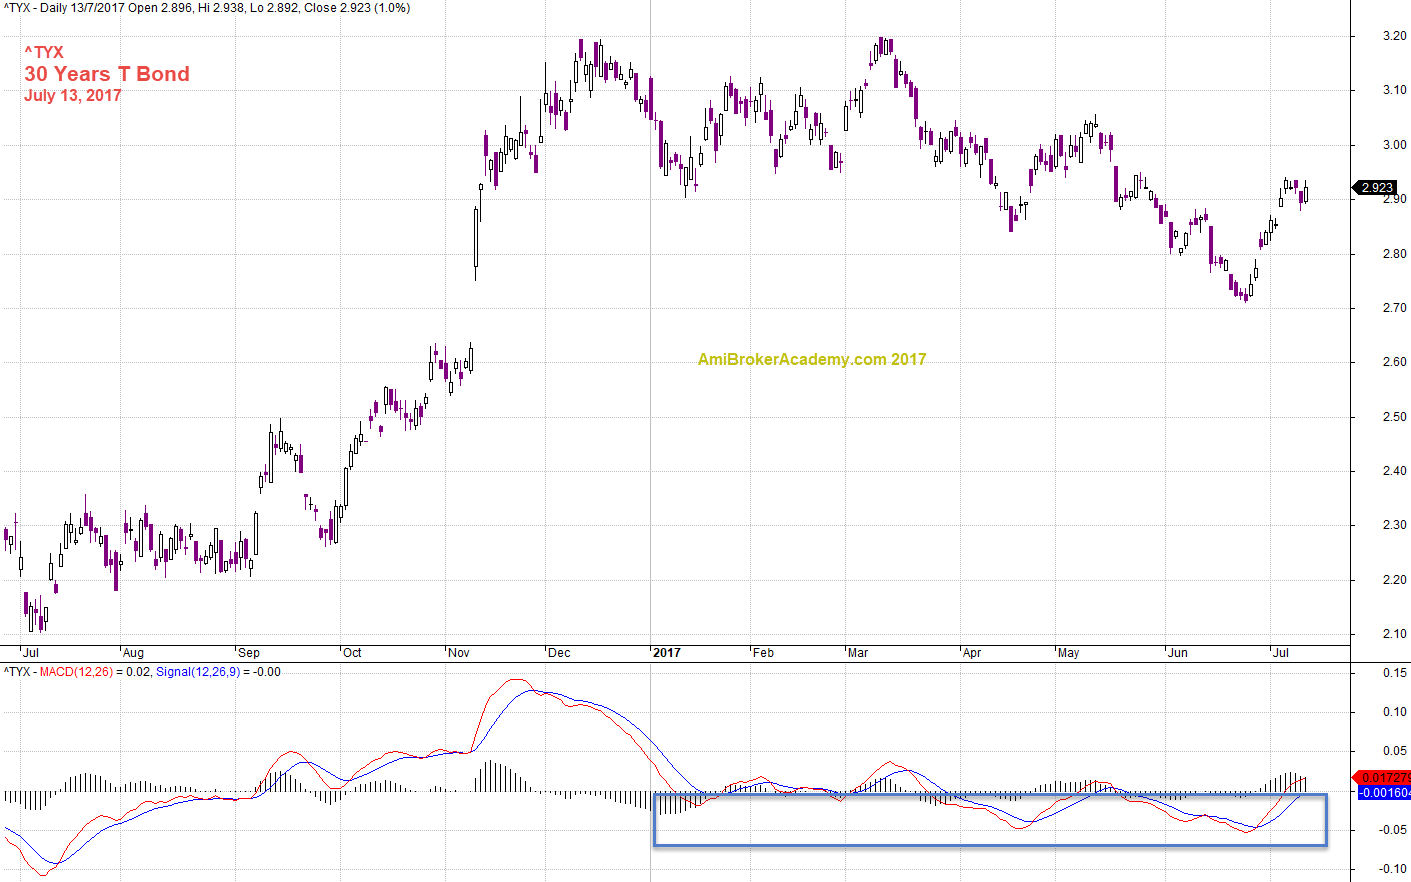
^TYX T Bond and MACD Indicator
Picture worth a thousand words. See chart for more on trend.
Bond is currently sideways.

July 13, 2017 T Bond and MACD Indicator
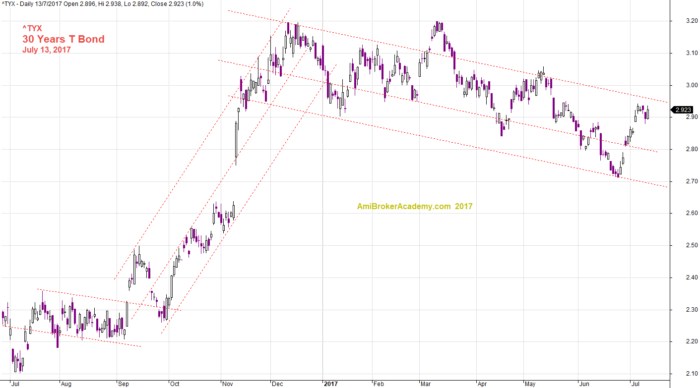
T Bond and Six Months Channel
See chart for more, the following channel is slightly different from other analysts.

July 13, 2017 T Bond and Channel, Six Months Channels
Moses
AmiBrokerAcademy.com
Disclaimer
The above result is for illustration purpose. It is not meant to be used for buy or sell decision. We do not recommend any particular stocks. If particular stocks of such are mentioned, they are meant as demonstration of Amibroker as a powerful charting software and MACD. Amibroker can program to scan the stocks for buy and sell signals.
These are script generated signals. Not all scan results are shown here. The MACD signal should use with price action. Users must understand what MACD and price action are all about before using them. If necessary you should attend a course to learn more on Technical Analysis (TA) and Moving Average Convergence Divergence, MACD.
Once again, the website does not guarantee any results or investment return based on the information and instruction you have read here. It should be used as learning aids only and if you decide to trade real money, all trading decision should be your own.
