3 May, 2018
Thank you for visiting the site. Hope you like the content.
Why MACDScan?
MACD is a leading indicator for trend change. So if a stock has a MACD signals, it means it is likely a trend change. Enjoy learning.
US Bank Index
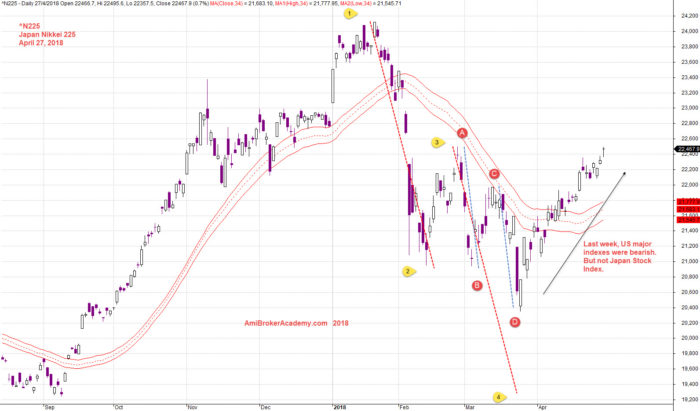
We saw majority of US stock indexes were bearish. But not for the bank index. Now, we see Japan stock index alos not bearish for last week. See chart below for more. Manage your risk.

April 27, 2018 Japan Nikkei 225 Index and MA Wave
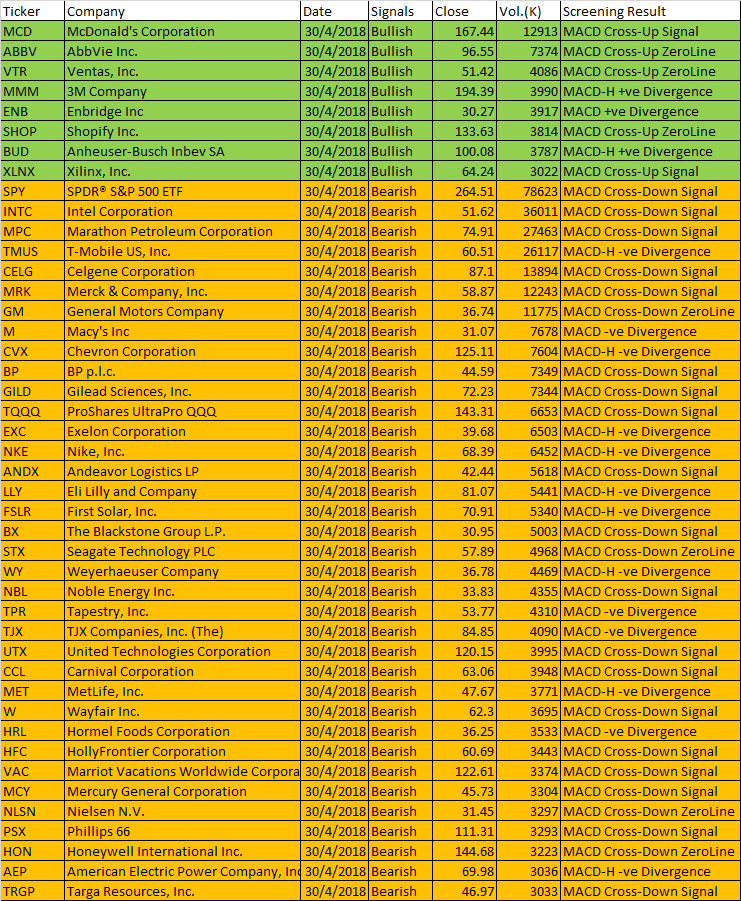
Free MACD Scan One-day US Stock MACD Screening Results on April 30 2018
Remember all setup can fail. This is true for all indicators. It is also true for MACD signals setup. See some of the MACD setup fail examples on this website.

April 30, 2018 US Stock One-day MACD Signals
These are the six types of MACD Signals:
- MACD line crosses above MACD signal – Bullish trend
- MACD line crosses above zero line – Bullish trend
- MACD Histogram +ve Divergence – Bullish trend
- MACD line crosses below MACD signal – Bearish trend
- MACD line crosses below zero line – Bearish trend
- MACD Histogram -ve Divergence – Bearish trend
| Ticker | Company | Date | Signals | Close | Vol.(K) | Screening Result |
| MCD | McDonald’s Corporation | 30/4/2018 | Bullish | 167.44 | 12913 | MACD Cross-Up Signal |
| ABBV | AbbVie Inc. | 30/4/2018 | Bullish | 96.55 | 7374 | MACD Cross-Up ZeroLine |
| VTR | Ventas, Inc. | 30/4/2018 | Bullish | 51.42 | 4086 | MACD Cross-Up ZeroLine |
| MMM | 3M Company | 30/4/2018 | Bullish | 194.39 | 3990 | MACD-H +ve Divergence |
| ENB | Enbridge Inc | 30/4/2018 | Bullish | 30.27 | 3917 | MACD +ve Divergence |
| SHOP | Shopify Inc. | 30/4/2018 | Bullish | 133.63 | 3814 | MACD Cross-Up ZeroLine |
| BUD | Anheuser-Busch Inbev SA | 30/4/2018 | Bullish | 100.08 | 3787 | MACD-H +ve Divergence |
| XLNX | Xilinx, Inc. | 30/4/2018 | Bullish | 64.24 | 3022 | MACD Cross-Up Signal |
| SPY | SPDR® S&P 500 ETF | 30/4/2018 | Bearish | 264.51 | 78623 | MACD Cross-Down Signal |
| INTC | Intel Corporation | 30/4/2018 | Bearish | 51.62 | 36011 | MACD Cross-Down Signal |
| MPC | Marathon Petroleum Corporation | 30/4/2018 | Bearish | 74.91 | 27463 | MACD Cross-Down Signal |
| TMUS | T-Mobile US, Inc. | 30/4/2018 | Bearish | 60.51 | 26117 | MACD-H -ve Divergence |
| CELG | Celgene Corporation | 30/4/2018 | Bearish | 87.1 | 13894 | MACD Cross-Down Signal |
| MRK | Merck & Company, Inc. | 30/4/2018 | Bearish | 58.87 | 12243 | MACD Cross-Down Signal |
| GM | General Motors Company | 30/4/2018 | Bearish | 36.74 | 11775 | MACD Cross-Down ZeroLine |
| M | Macy’s Inc | 30/4/2018 | Bearish | 31.07 | 7678 | MACD -ve Divergence |
| CVX | Chevron Corporation | 30/4/2018 | Bearish | 125.11 | 7604 | MACD-H -ve Divergence |
| BP | BP p.l.c. | 30/4/2018 | Bearish | 44.59 | 7349 | MACD Cross-Down Signal |
| GILD | Gilead Sciences, Inc. | 30/4/2018 | Bearish | 72.23 | 7344 | MACD Cross-Down Signal |
| TQQQ | ProShares UltraPro QQQ | 30/4/2018 | Bearish | 143.31 | 6653 | MACD Cross-Down Signal |
| EXC | Exelon Corporation | 30/4/2018 | Bearish | 39.68 | 6503 | MACD-H -ve Divergence |
| NKE | Nike, Inc. | 30/4/2018 | Bearish | 68.39 | 6452 | MACD-H -ve Divergence |
| ANDX | Andeavor Logistics LP | 30/4/2018 | Bearish | 42.44 | 5618 | MACD Cross-Down Signal |
| LLY | Eli Lilly and Company | 30/4/2018 | Bearish | 81.07 | 5441 | MACD-H -ve Divergence |
| FSLR | First Solar, Inc. | 30/4/2018 | Bearish | 70.91 | 5340 | MACD-H -ve Divergence |
| BX | The Blackstone Group L.P. | 30/4/2018 | Bearish | 30.95 | 5003 | MACD Cross-Down Signal |
| STX | Seagate Technology PLC | 30/4/2018 | Bearish | 57.89 | 4968 | MACD Cross-Down ZeroLine |
| WY | Weyerhaeuser Company | 30/4/2018 | Bearish | 36.78 | 4469 | MACD-H -ve Divergence |
| NBL | Noble Energy Inc. | 30/4/2018 | Bearish | 33.83 | 4355 | MACD Cross-Down Signal |
| TPR | Tapestry, Inc. | 30/4/2018 | Bearish | 53.77 | 4310 | MACD -ve Divergence |
| TJX | TJX Companies, Inc. (The) | 30/4/2018 | Bearish | 84.85 | 4090 | MACD -ve Divergence |
| UTX | United Technologies Corporation | 30/4/2018 | Bearish | 120.15 | 3995 | MACD Cross-Down Signal |
| CCL | Carnival Corporation | 30/4/2018 | Bearish | 63.06 | 3948 | MACD Cross-Down Signal |
| MET | MetLife, Inc. | 30/4/2018 | Bearish | 47.67 | 3771 | MACD-H -ve Divergence |
| W | Wayfair Inc. | 30/4/2018 | Bearish | 62.3 | 3695 | MACD Cross-Down Signal |
| HRL | Hormel Foods Corporation | 30/4/2018 | Bearish | 36.25 | 3533 | MACD -ve Divergence |
| HFC | HollyFrontier Corporation | 30/4/2018 | Bearish | 60.69 | 3443 | MACD Cross-Down Signal |
| VAC | Marriot Vacations Worldwide Corporation | 30/4/2018 | Bearish | 122.61 | 3374 | MACD Cross-Down Signal |
| MCY | Mercury General Corporation | 30/4/2018 | Bearish | 45.73 | 3304 | MACD Cross-Down Signal |
| NLSN | Nielsen N.V. | 30/4/2018 | Bearish | 31.45 | 3297 | MACD Cross-Down ZeroLine |
| PSX | Phillips 66 | 30/4/2018 | Bearish | 111.31 | 3293 | MACD Cross-Down Signal |
| HON | Honeywell International Inc. | 30/4/2018 | Bearish | 144.68 | 3223 | MACD Cross-Down ZeroLine |
| AEP | American Electric Power Company, Inc. | 30/4/2018 | Bearish | 69.98 | 3036 | MACD-H -ve Divergence |
| TRGP | Targa Resources, Inc. | 30/4/2018 | Bearish | 46.97 | 3033 | MACD Cross-Down Signal |
Have fun! Reader must understand what MACD is all about before using the results.
Moses US Stock Scan
AmiBroker Academy.com
Disclaimer:
The above result is for illustration purpose. It is not meant to be used for buy or sell decision. We do not recommend any particular stocks. If particular stocks of such are mentioned, they are meant as demonstration of Amibroker as a powerful charting software and MACD. Amibroker can program to scan the stocks for buy and sell signals.
These are script generated signals. Not all scan results are shown here. The MACD signal should use with price action. Users must understand what MACD and price action are all about before using them. If necessary you should attend a course to learn more on Technical Analysis (TA) and Moving Average Convergence Divergence, MACD.
Once again, the website does not guarantee any results or investment return based on the information and instruction you have read here. It should be used as learning aids only and if you decide to trade real money, all trading decision should be your own.
