Welcome to AmiBroker Academy dot com.
Practice Practice Practice
Practice makes perfect! We know Moving Average is a powerful visual tool to spot trend and bullish or bearish bias trending. As a trader to new to sharpen your tool. How to sharpen? Practice by study the chart to identify bullish or bearish bias trend. Practice to look for support and resistance. Practice to confirm the pattern is completed and ready to enter a trade!
Applied Materials Inc
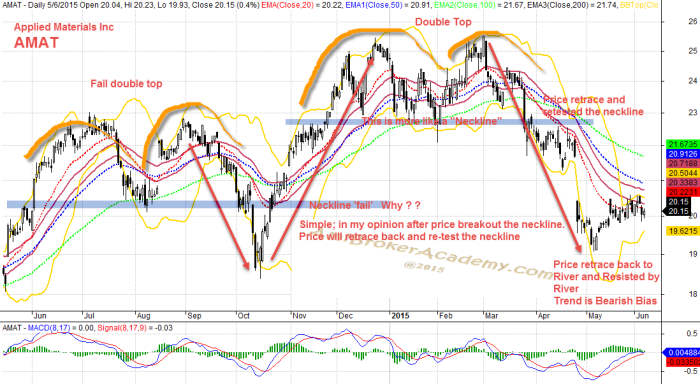
From chart, what is your conclusion? Buy or sell? The price has retraced back to River and Resisted by real.
Let’s look at the chart again, this is a twelve (12) daily data chart. You can see the first double top; fail double top. Why? Double top is a signal of trend reversal; change of trend direction. From up flow to become down and continue to stay down for sometime. But, you see the trend get higher.
The new double top has pull back and retest the neckline and continue the south. At least, this provide some clue to be bearish. Now, the second time price retrace back to the moving averages, such as River. The price also get resisted by River. The conclusion at this point is very much bearish bias.
You may try selling begin with a small trade to test the bearish trend. Have fun!
Thanks for visiting the website.
Moses
DISCLAIMER
Site advice, “Stock trading is not a get rich quick scheme and it is high risk”.
Information provided here is of the nature of a general comment only and no intend to be specific for trading advice. It has prepared without regard to any particular investment objectives, financial situation or needs. Information should NOT be considered as an offer or enticement to buy, sell or trade.
You should seek advice from your broker, or licensed investment advisor, before taking any action.
The website does not guarantee any results or investment return based on the information and instruction you have read here. It should be used as learning aids.


