Welcome to AmiBrokerAcademy.com.
We have not been tracking BABA stock for sometime. November 11, 1111, China’s Bachelor Day. Bachelor, a man who is not and has never been married. It is a busy shopping day in China. It is like Black Friday in United States, a busy shopping day.
Last year, Alibaba holds its first record of sales. This year Alibaba broke the last year record.
So, how is the Alibaba stock performance? Picture worth a thousand words.
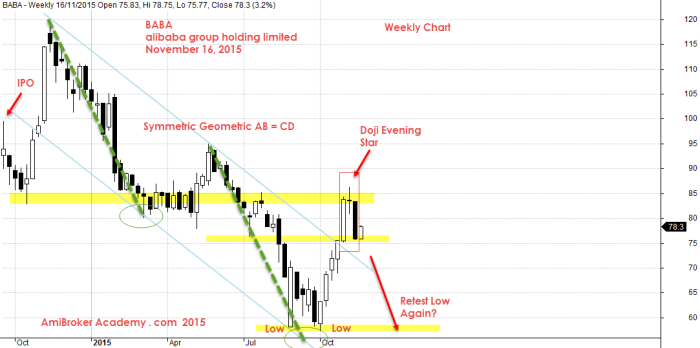
BABA, Alibaba Group Holding Limited Weekly
On a higher time frame, sometime can give your clearer picture of what the market emotion, as it has less bar or candlesticks. You may easily spot the price action has completed a symmetric geometry AB = CD chart pattern within the equal distance channel. Now, the stock is in the AB = CD buy pattern. True? Will there are many resistance to prevent the price from travelling north. Picture tell the thousands words.
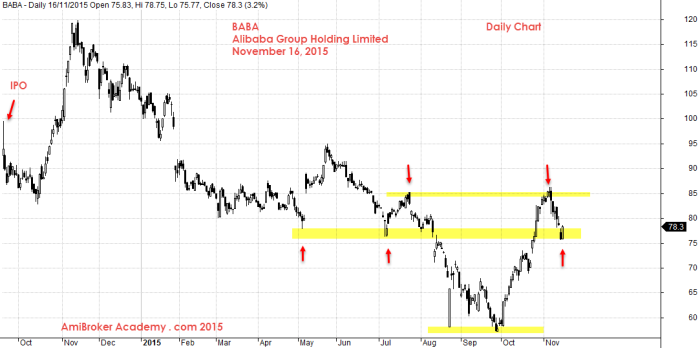
Alibaba Group Holding Daily Chart
When you can not see the direction clearly, you should always try a different timeframe. Put remember, the lower the time frame the more price action, line, bar or candlesticks. This may confuse most traders. So, you can than try to move to a higher time frame to check.
You can read about other stock scan and analysis here. Hope these analysis can value add your trading strategy.
Moses Stocks Scan
Disclaimer: All information, data and material contained, presented, or provided on amibrokeracademy.com is for educational purposes only. It is not to be construed or intended as providing trading or legal advice. Decisions you make about your trading or investment are important to you and your family, therefore should be made in consultation with a competent financial advisor or professional. We are not financial advisor and do not claim to be. Any views expressed here-in are not necessarily those held by amibrokeracademy.com. You are responsible for your trade decision and wealth being.


