Welcome! Welcome to AmiBrokerAcademy.com.
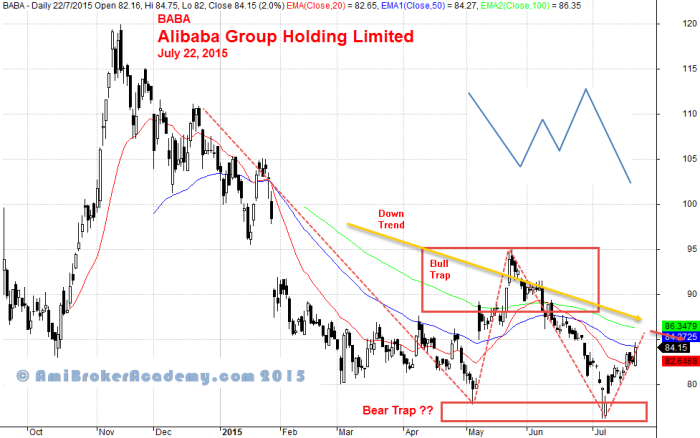
Alibaba Group Holding Limited BABA Stock Analysis and Moving Average
Moving Average is a great and convenient tool to visual inspect the chart. When price action is below the fast moving average, such as 20 MA. It gives you the understanding the probability for price to go up is less. So, vise verse for price action is above the fast ma.
The price action is near bottom, assume it is true. Monitor for Gartley reversal trade strategy. See the explanation on Gartley Reversal Strategy on the earlier posting. Have fun!
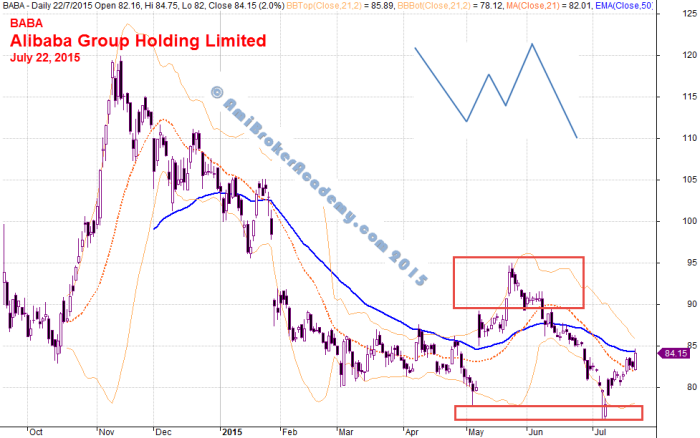
Alibaba Group Holding Limited Stock Analysis and Bollinger Band
You can spot bull trap and bear trap. Basically, when the trend reversal after the bull or bear trend and those whom just join the trend get caught, means trap.
After a downtrend, the price action try to test and retest the same level. Possible reverse.
Thanks for visiting the website.
Moses
DISCLAIMER
Site advice, “Stock trading is not a get rich quick scheme and it is high risk”.
Information provided here is of the nature of a general comment only and no intend to be specific for trading advice. It has prepared without regard to any particular investment objectives, financial situation or needs. Information should NOT be considered as an offer or enticement to buy, sell or trade.
You should seek advice from your broker, or licensed investment advisor, before taking any action.
The website does not guarantee any results or investment return based on the information and instruction you have read here. It should be used as learning aids.


