November 24, 2016
US Stock Analysis – MA
What follows is the best assessment of what’s happening of this stock. After looking at it for some time this is what you get.
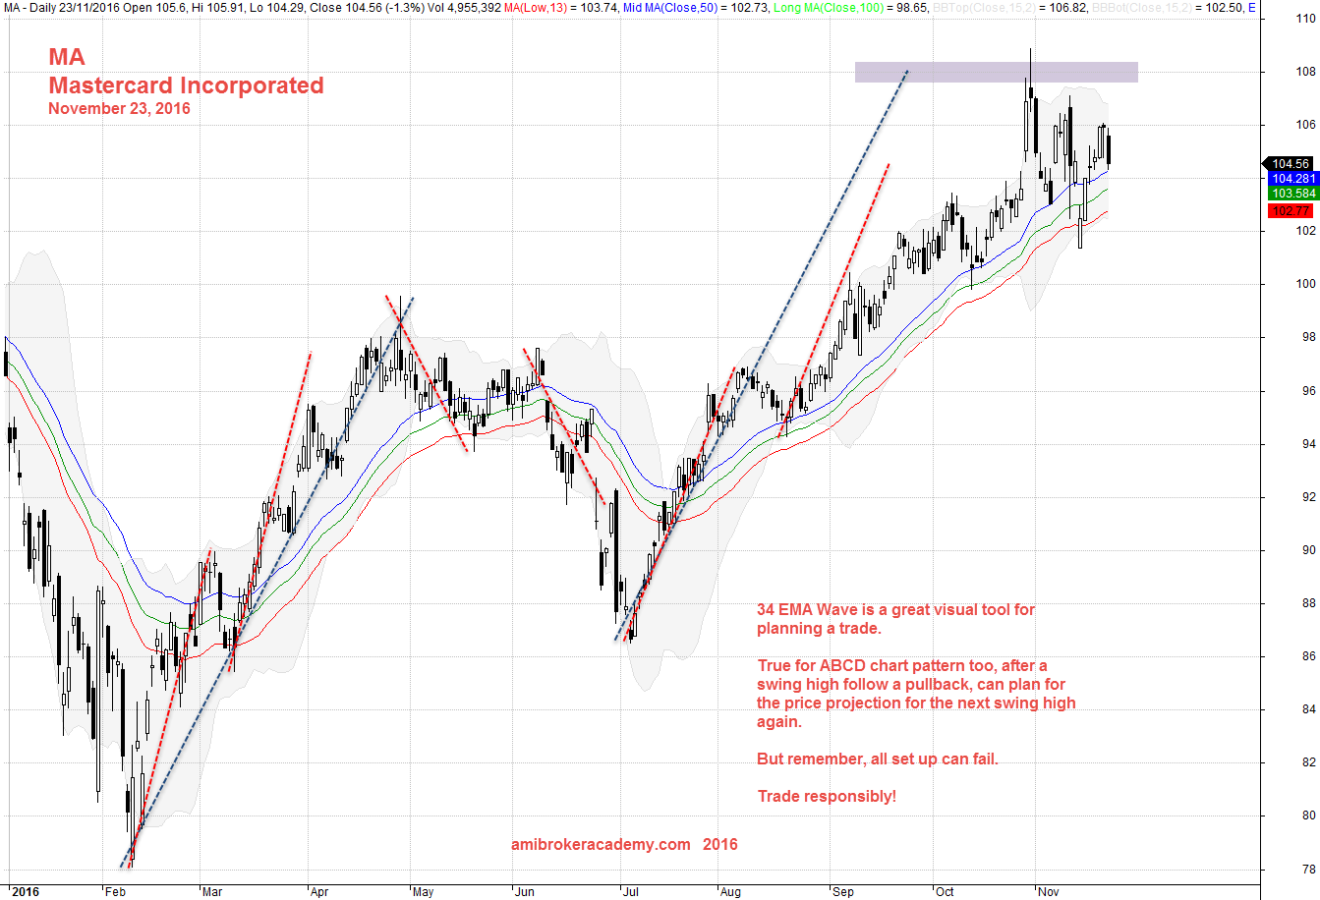
MA | Mastercard Incorporated Daily Chart
You can easily identify many ABCD Chart Pattern. Moving average is a very useful visual tool to understand the trend. As long as the price action is bouncing above the MA, and the MA is slopping up. It is an uptrend market.

November 23, 2016 Mastercard Incorporated Daily from 2016
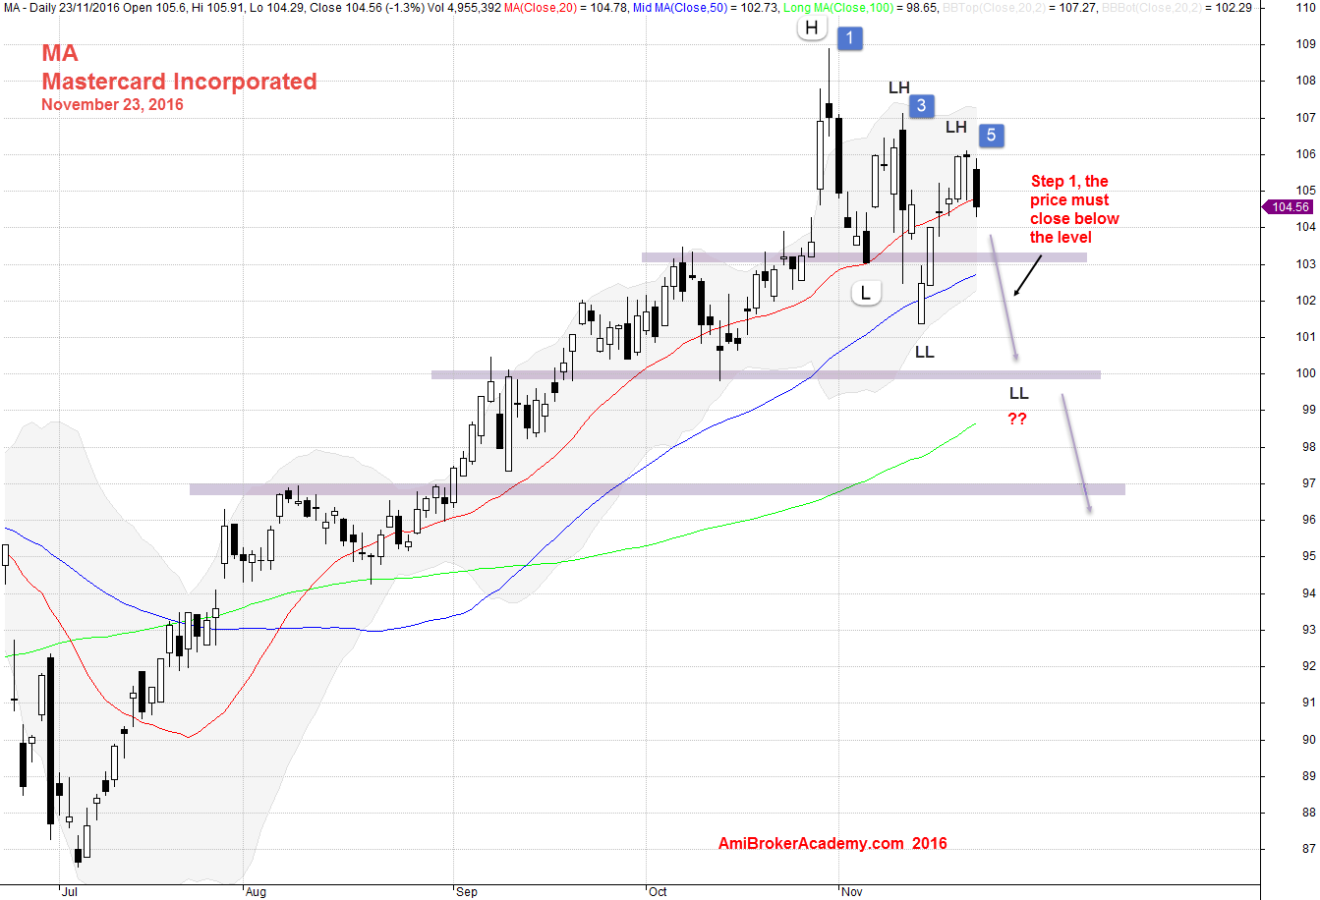
MA | Mastercard Incorporated Stock Analysis
MA begin to form lower high and lower low. When the price continue to move south, the pullback will become a reversal.

November 23, 2016 MA Mastercard Incorporated Daily
Happy Thanksgiving! Have you join the Black Friday Sale!
Have fun!
Moses Stock Analysis
AmiBrokerAcademy.com
Disclaimer: All information, data and material contained, presented, or provided on amibrokeracademy.com is for educational purposes only. It is not to be construed or intended as providing trading or legal advice. Decisions you make about your trading or investment are important to you and your family, therefore should be made in consultation with a competent financial advisor or professional. We are not financial advisor and do not claim to be. Any views expressed here-in are not necessarily those held by amibrokeracademy.com. You are responsible for your trade decision and wealth being.
