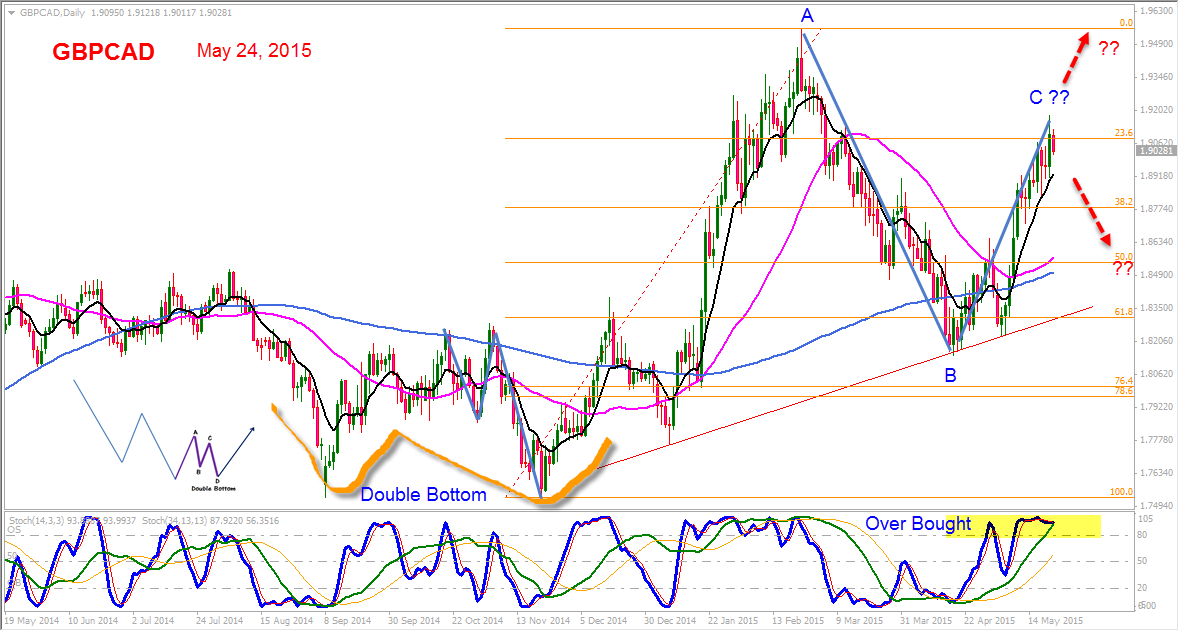
On May 17, we analyse Forex GBPCAD using H M Gartley ABCD. Have you make money last week?
Let continue to look at the chart to find the new development.
May 24, 2015 GBPCAD Daily Chart Analysis
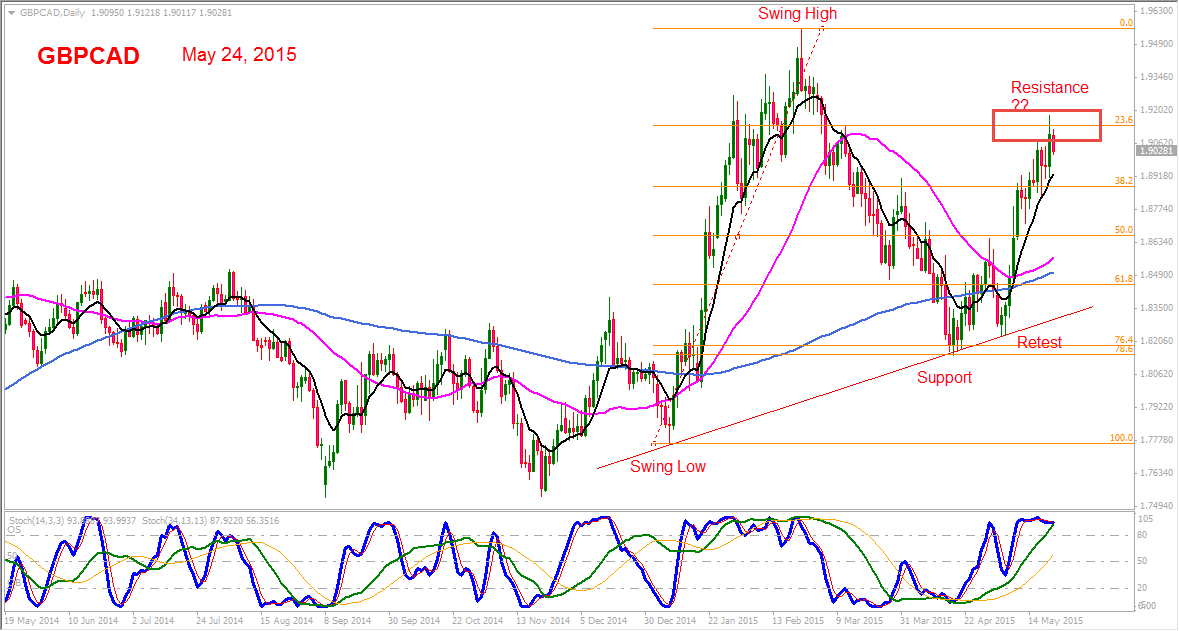
Is the price near support or resistance? If you draw a swing low to swing high using Fibonacci, is the price near any important level of Fibonacci?
We are see the price is moving from wave B to complete wave C.
Re-draw the swing low to swing high, to let the wave B sit on an important Fibonacci important level and see the outcome. Has Wave C completed? As the price met an important Fibonacci level. Will see.
See the last posting on May 17 2015 Daily Chart Analysis for more information.
Thanks for visiting the website. The website will post regularly Forex analysis for educational purpose.
Moses
DISCLAIMER
Site advice, “Trading is a journey, financial trading such as Forex trading is not a get rich quick scheme and it is high risk”.
Information provided here is of the nature of a general comment or educational only and no intend to be specific for trading advice. It has prepared without regard to any particular investment objectives, financial situation or needs. Information should NOT be considered as an offer or enticement to buy, sell or trade.
You should seek advice from your broker, or licensed investment advisor, before taking any action.
The website does not guarantee any results or investment return based on the information and instruction you have read here. It should be used as learning aids.
Gartley is H M Gartley, a prominent technical analysis best known for retracement patterns, Gartley patterns.


