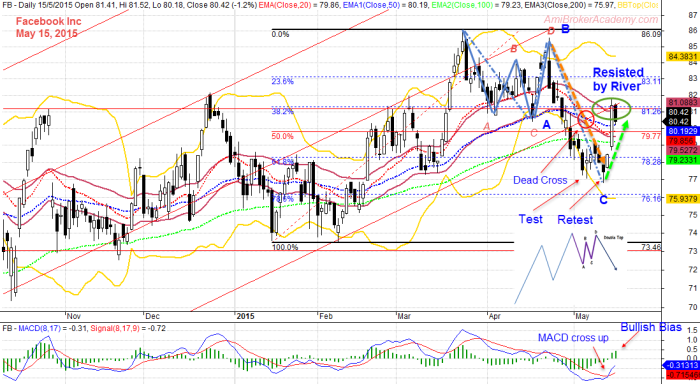
May 15, 2015 Facebook Stock Analysis
Is Facebook Stock into a reversal phase? Or the reversal phase is over? We see River resisting the PA, we see MACD Histogram bullish bias. However, we see 20 and 50 MAs dead cross, price action trace along the lower band of Bollinger bands and in the lower half of Bollinger bands. Wow, so complicated! You see the fun of TA is slowly appreciate the chart; chart worth a thousand words. Chart patterns will reveal itself step by step.
We see the price action were bouncing above River or MAs, then we see the reversal symptom; when price action crossed below River and resisted by River. We also see price formed lower low, and price retested the same height.
You can see the previous posting, See link as follows
1) Facebook Inc Technical Analysis Update | Moses’ Stock Column
If you enjoy reading, you can find other posting for previous analysis and view of the stock.
Thanks for visiting the website. The website will post regularly Facebook Stock analysis for educational purpose.
Moses
DISCLAIMER
Site advice, “Trading is a journey, financial trading such as Stock trading is not a get rich quick scheme and it is high risk”.
Information provided here is of the nature of a general comment or educational only and no intend to be specific for trading advice. It has prepared without regard to any particular investment objectives, financial situation or needs. Information should NOT be considered as an offer or enticement to buy, sell or trade.
You should seek advice from your broker, or licensed investment advisor, before taking any action.
The website does not guarantee any results or investment return based on the information and instruction you have read here. It should be used as learning aids.
Gartley is H M Gartley, a prominent technical analysis best known for retracement patterns, Gartley patterns.

