April 13, 2015
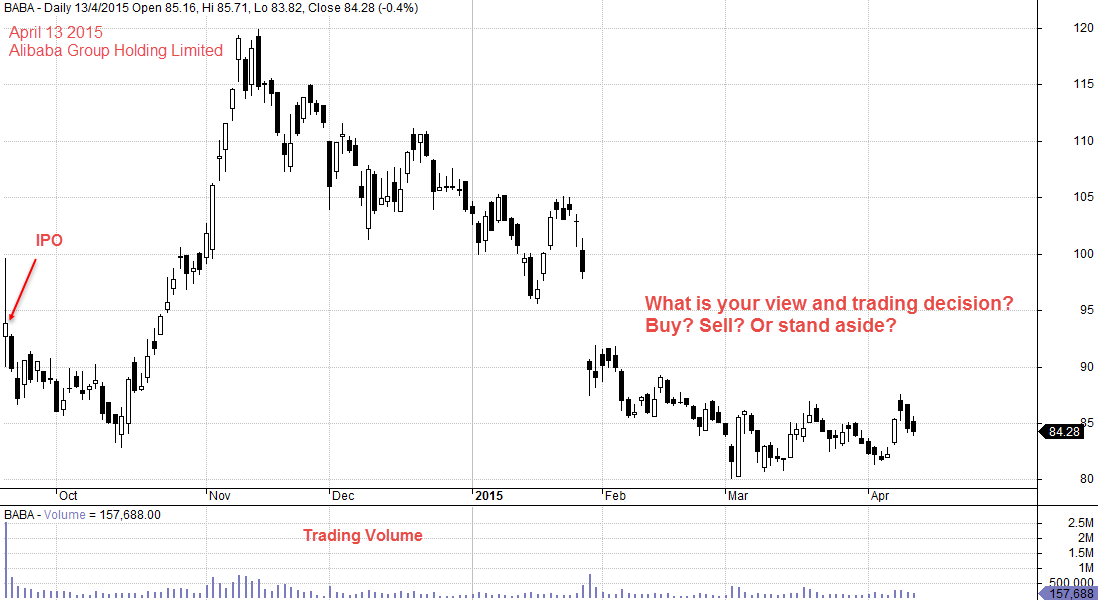
As a trader you need a few months of data on price and volume to determine the stock trend. This is what a technical traders requirement to study a stock trend. Is price up or down? For Alibaba Group Holding Ltd. (NYSE:BABA) charts below are its stock performance for the last few month since IPO. BABA stock started last (2014) late October, rested for a few days, and then moved up quickly with a momentum, however the momentum ran out of steam. Now the price is below it IPO price. Is it a good time to buy? What is your thought? Put on a technical analyst, what will you say?
Alibaba, BABA Technical Analysis
For a start right after its IPO, the stock gained it momentum and rush up, overtime the momentum and interest ran out, the price slide down. Over three months, the stock price fallen below IPO price. Many has got their fingers burnt at the peak, to redistribute their cash. Event at a lost also cash out. The stock now went below IPO price, and is sideways.
So what is your view and trading strategy? Buy? Sell? Or stand aside and wait?
If you are TA (Technical Analysis) what will you do?
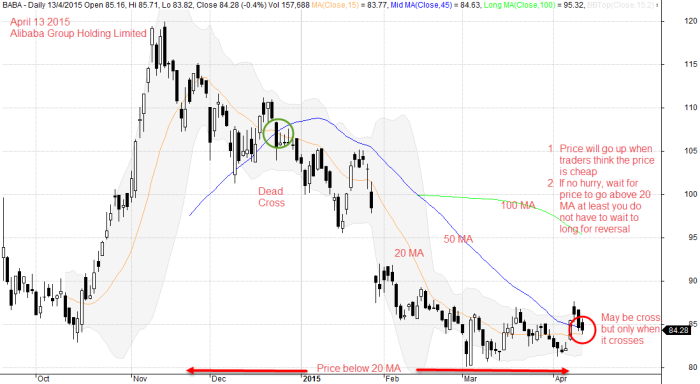
Alibaba Group Holding stock price crossed 20 MA in near end of last November, thereafter the price has stay below 20 MA. Your buying strategy may want to wait for price cross above 20 MA and stay above 20 MA. It will be even better when 20 MA cross above 50 and 100 MAs.
As a experienced trader, you are aware that the price is moving in zigzag. In order for the price to move up, the price will have to move down first. Of course there are exception. Remember, only until the rule is broken, then it is confirm the trend is true.
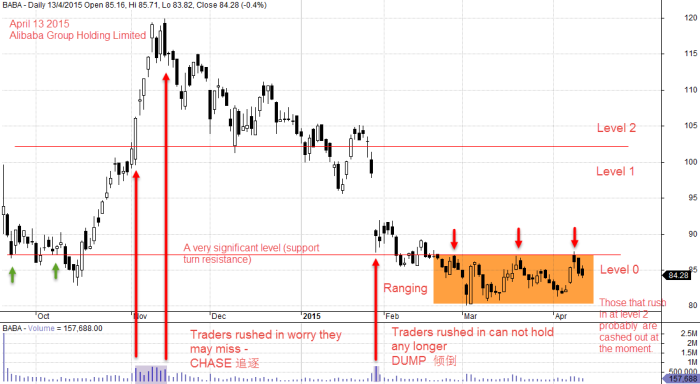
From a S&R, Support and Resistance understanding, Alibaba Group Holding looks like divided in three level. Level 0, 1 and 2. Price has moved from Level 1 to 2 and fall through Level 1 to Level 0. Now the price is traveled in level 0, ranging. Ranging is very difficult to trade. Of course you can trade between the support and resistance. Buy support and sell resistance.
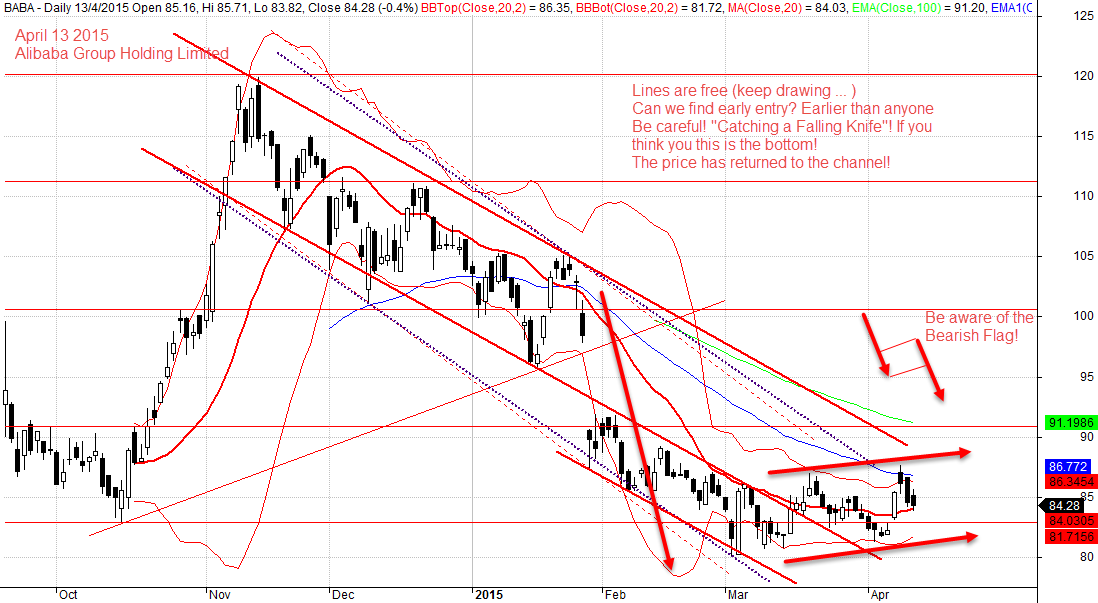
If you want to find early entry, you can add trend lines. One effective way is add channels, instead of draw one trendline; connecting either the valleys or the mountains. You draw the first trendline, copy the trendline and paste it on the opposite sides; copy the valleys trendline and paste on mountains, and vice verse.
You will see price trap in the channels. The price will move from one channel to the other.
In trading we are looking to buy low and sell high. The break away of the channel is an indication of reversal. However, be aware of the traps, bull or bear trap.
Look carefully, can the bear flag pattern is in the process of building? Will you will know, when the bear flag is completed.
All setup can fail, and pattern only true when it is completed.
You can find other Alibaba Group Holding technical analysis on this site.
Thanks for visiting this extra ordinary site, AmiBrokerAcademy.com.
It is always to see with other analysis. However, you should do your own eventually. You will have a lot of fun.
Moses
DISCLAIMER
Site advice, “Stock trading is not a get rich quick scheme and it is high risk”.
Information provided here is of the nature of a general comment only and no intend to be specific for trading advice. It has prepared without regard to any particular investment objectives, financial situation or needs. Information should NOT be considered as an offer or enticement to buy, sell or trade.
You should seek advice from your broker, or licensed investment advisor, before taking any action.
The website does not guarantee any results or investment return based on the information and instruction you have read here. It should be used as learning aids.
MORE DISCLAIMER
THE CONTENTS HERE REFLECT THE AUTHOR’S VIEWS ACQUIRED THROUGH HIS EXPERIENCE ON THE TOPIC. THE AUTHOR OR WEBSITE DISCLAIMS ANY LOSS OR LIABILITY CAUSED BY THE UTILIZATION OF ANY INFORMATION PRESENTED HEREIN.
BESIDES THAT THE SOURCES MENTIONED HEREIN ARE ASSUMED TO BE RELIABLE AT THE TIME OF WRITING, THE AUTHOR AND WEBSITE ARE NOT RESPONSIBLE FOR THEIR ACCURACY AND ACTIVITIES.
THE CONTENT ONLY SHOULD BE CONSIDERED SOLELY FOR BASIC INFORMATION. COPYRIGHT © 2015 Moses @ AmiBrokerAcademy.com. ALL RIGHTS RESERVED.
NO PART OF THE CONTENT MAY BE ALTERED, COPIED, OR DISTRIBUTED, WITHOUT PRIOR WRITTEN PERMISSION OF THE AUTHOR OR SITE.
ALL PRODUCT NAMES, LOGOS, AND TRADEMARKS ARE PROPERTY OF THEIR RESPECTIVE OWNERS WHO HAVE NOT NECESSARILY ENDORSED, SPONSORED, REVIEWED OR APPROVED THIS PUBLICATION.
TEXT AND IMAGES AVAILABLE OVER THE INTERNET AND USED IN THE WEBSITE’s CONTENT MAY BE SUBJECT TO INTELLECTUAL RIGHTS AND MAY NOT BE COPIED FROM THE WEBSITE.


