11 November, 2018
Thanks for visiting the site.
Can the stock price action continue to hold up or drop down? Well, price action is moving in zigzag manner. So, the price action will continue to move up or move down.
Just remember, there is no right no wrong in this world. What was right in the past may not be right today. Just make sure to manage your risk.
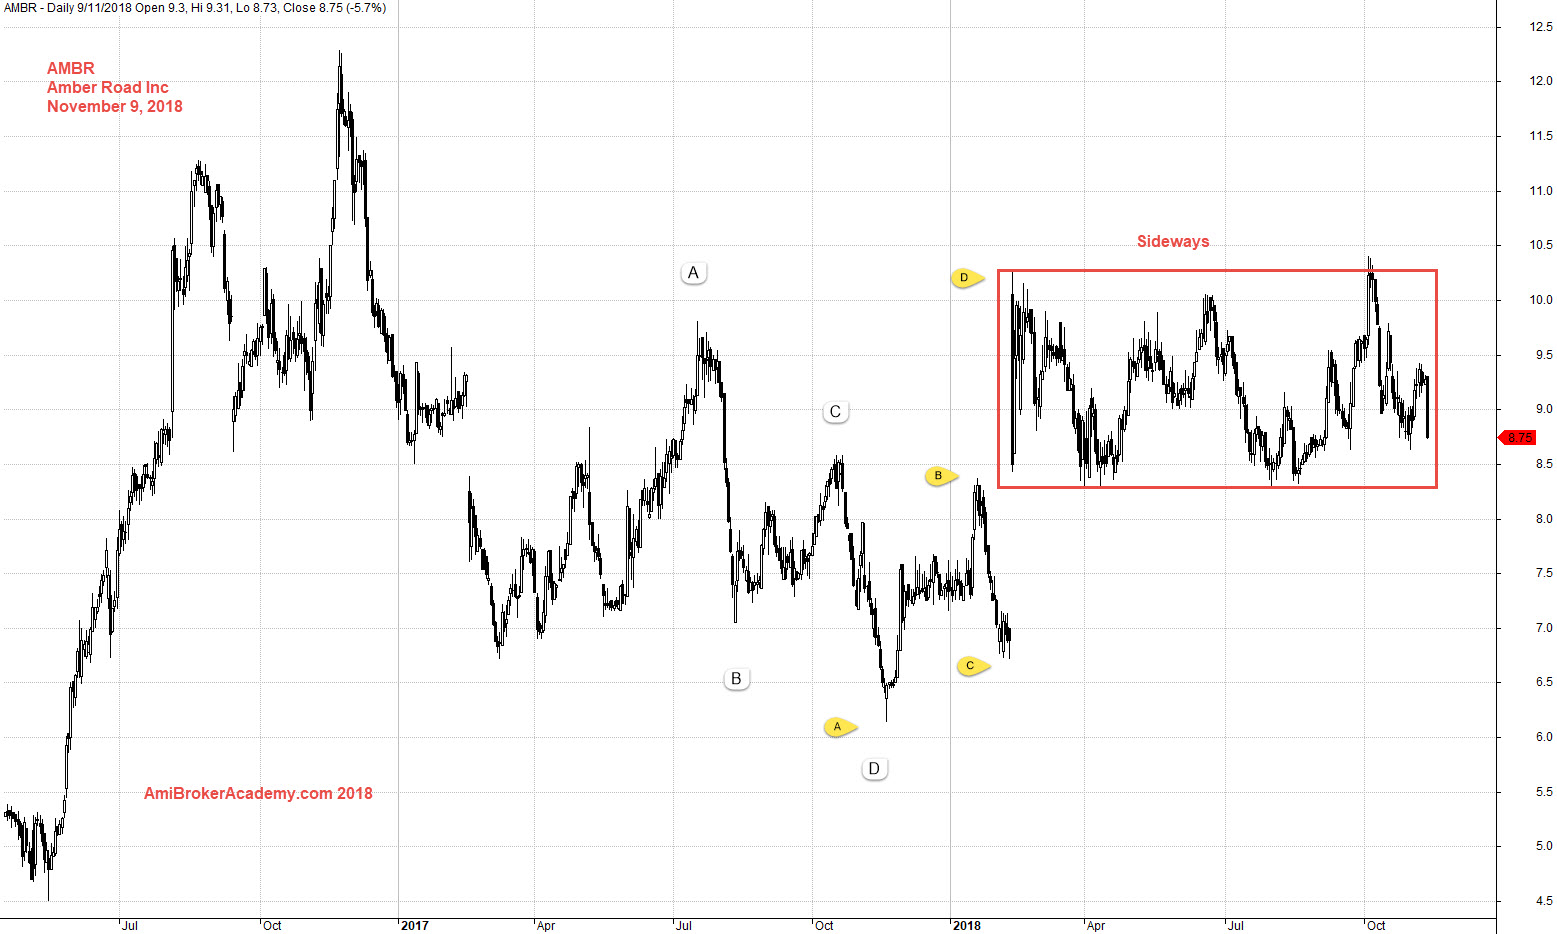
AMBR Amber Road Inc Daily Charting
Buy Support Sell Resistance
Buy Low Sell High
Study chart of Amber Road Inc stock chart. If apply buy hold strategy for such stock see chart of price action from 2016.
What so great about H M Gartley 222 pattern? If you are observing enough, there are many H M Gartley 222 pattern, just mark a few for your reference. Even within the sideways box, you could also easily find H M Gartley pattern.
Remember trade with eyes open.
Think think got more things.
Manage your risk.
November 9, 2018 Amber Road Inc Charting
if you can see the full chart, “press Ctrl and -” to zoom out and see the entire chart.
Zoom In and add MACD indicator, see chart. You continue to see many H M Gartley 222 pattern. Trade with your own risk management.
Some may ask, what is H M Gartley 222? You could google and read bout it in https://www.babypips.com/
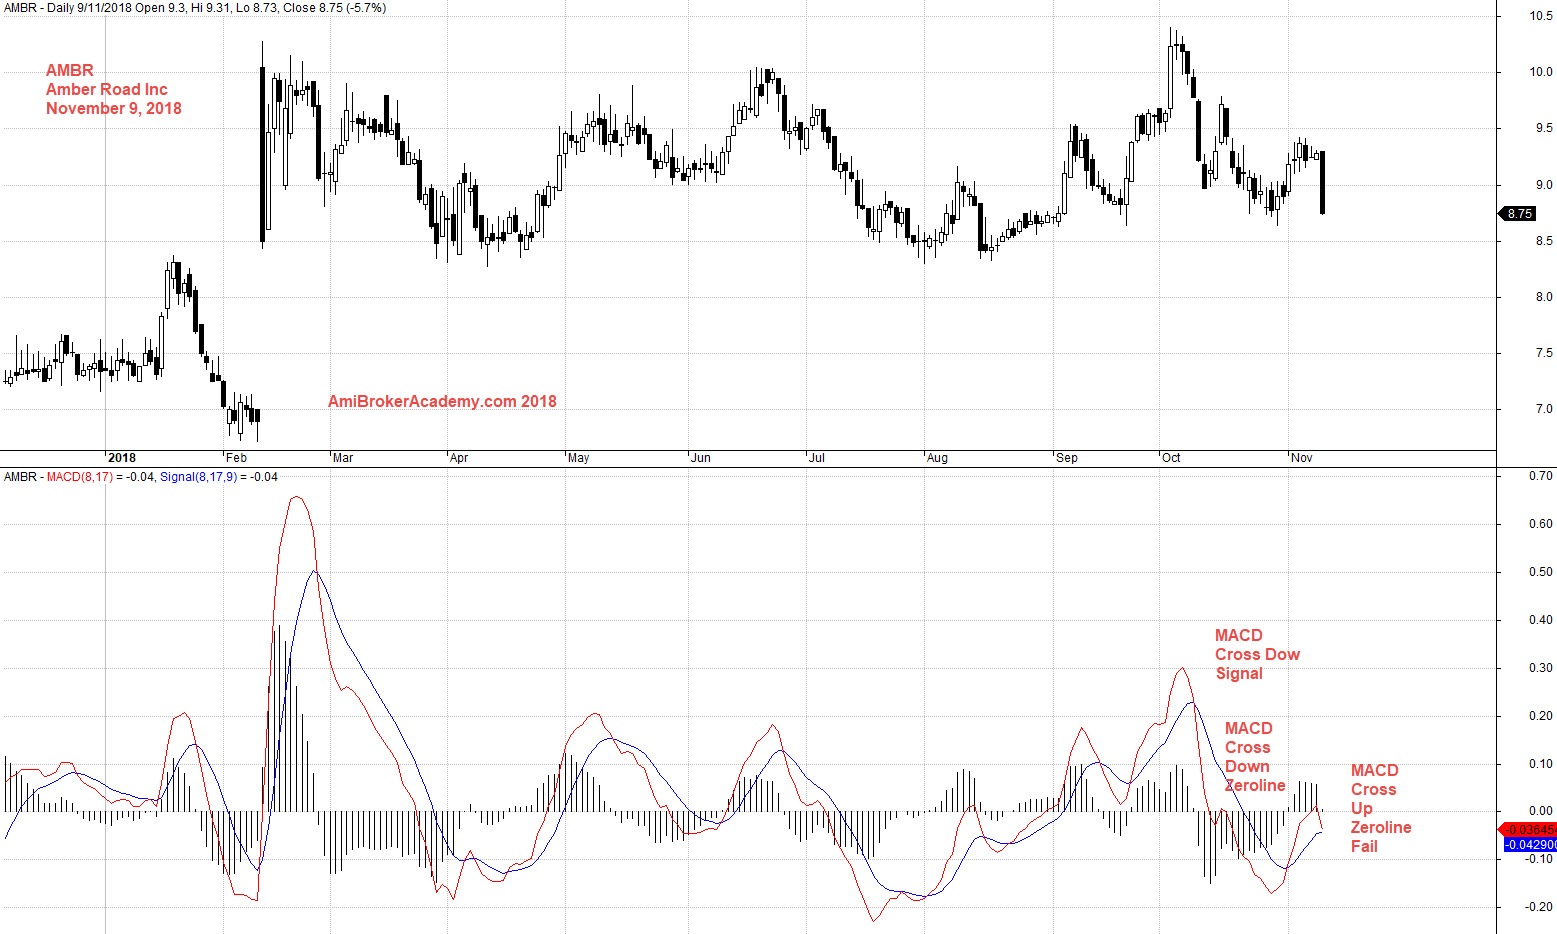
November 9, 29018 Amber Road Inc and MACD
Moses US Stock Chart Analysis
AmiBrokerAcademy.com
Disclaimer
The above result is for illustration purpose. It is not meant to be used for buy or sell decision. We do not recommend any particular stocks. If particular stocks of such are mentioned, they are meant as demonstration of Amibroker as a powerful charting software and MACD. Amibroker can program to scan the stocks for buy and sell signals.
These are script generated signals. Not all scan results are shown here. The MACD signal should use with price action. Users must understand what MACD and price action are all about before using them. If necessary you should attend a course to learn more on Technical Analysis (TA) and Moving Average Convergence Divergence, MACD.
Once again, the website does not guarantee any results or investment return based on the information and instruction you have read here. It should be used as learning aids only and if you decide to trade real money, all trading decision should be your own.