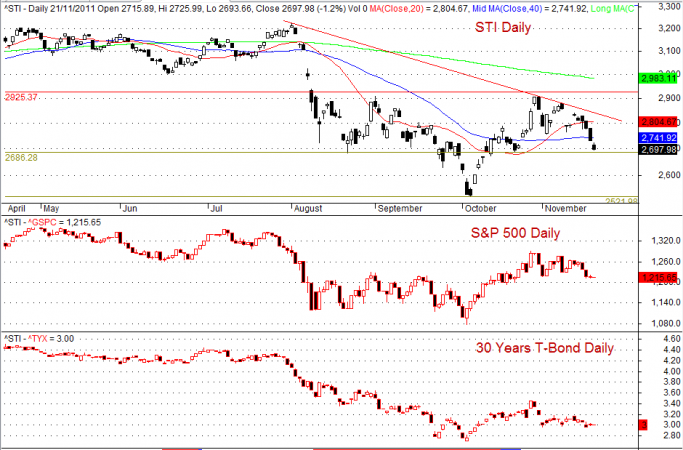
The Singapore Markets opened low, gap down to open at 2715.89, which created a 14.45 points gap. The STI (Straits Times Index) ended the day at 2697.98, another 17.91 points lower from the market open. Although the buyers try hard to push the market up but fail. As some stay sideways and many sell to take profit. So, in total it was a 32.36 points lower as compare to last week closed. It is a 5 days down since last week. Will market continue to be bearish? Chart show you the market emotions.
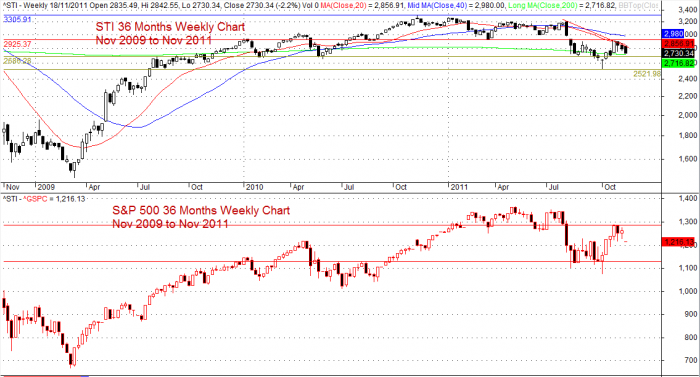
There is a strong 36-month correlation between STI and S&P500. It seems that the both indices have moving in tandem. Those that look diversification, then do not trade both indices at the same time; when one goes wrong and will mean both investments are wrong. See Chart.
Further more, if you compare STI, S&P500 and 30 Years T-Bond, you can also find similar correlation among them. See chart that follows. From here you can see the power of the Amibroker charting software. You could insert three different price or index on the same chart. You could see them in one view and compare their correlation.
Disclaimer
The above result is for illustration purpose. It is not meant to be used for buy or sell decision. We do not recommend any particular stocks. If particular stocks or indices of such are mentioned, they are meant as demonstration of Amibroker as a powerful charting software. Example, it can insert another price or index such as S&P 500.
Once again, the website does not guarantee any results or investment return based on the information and instruction you have read here. Please get your advice from the professional financial consultant.


