5 February, 2019
Welcome to AmiBrokerAcademy.com. We provide US stock analysis for academy learning.
Think!
Happy Chinese New Year. Wishing you all the best.

^GSPC S&P 500 Index Stock Charting
Study Standard and Poors 500 Index stock chart.
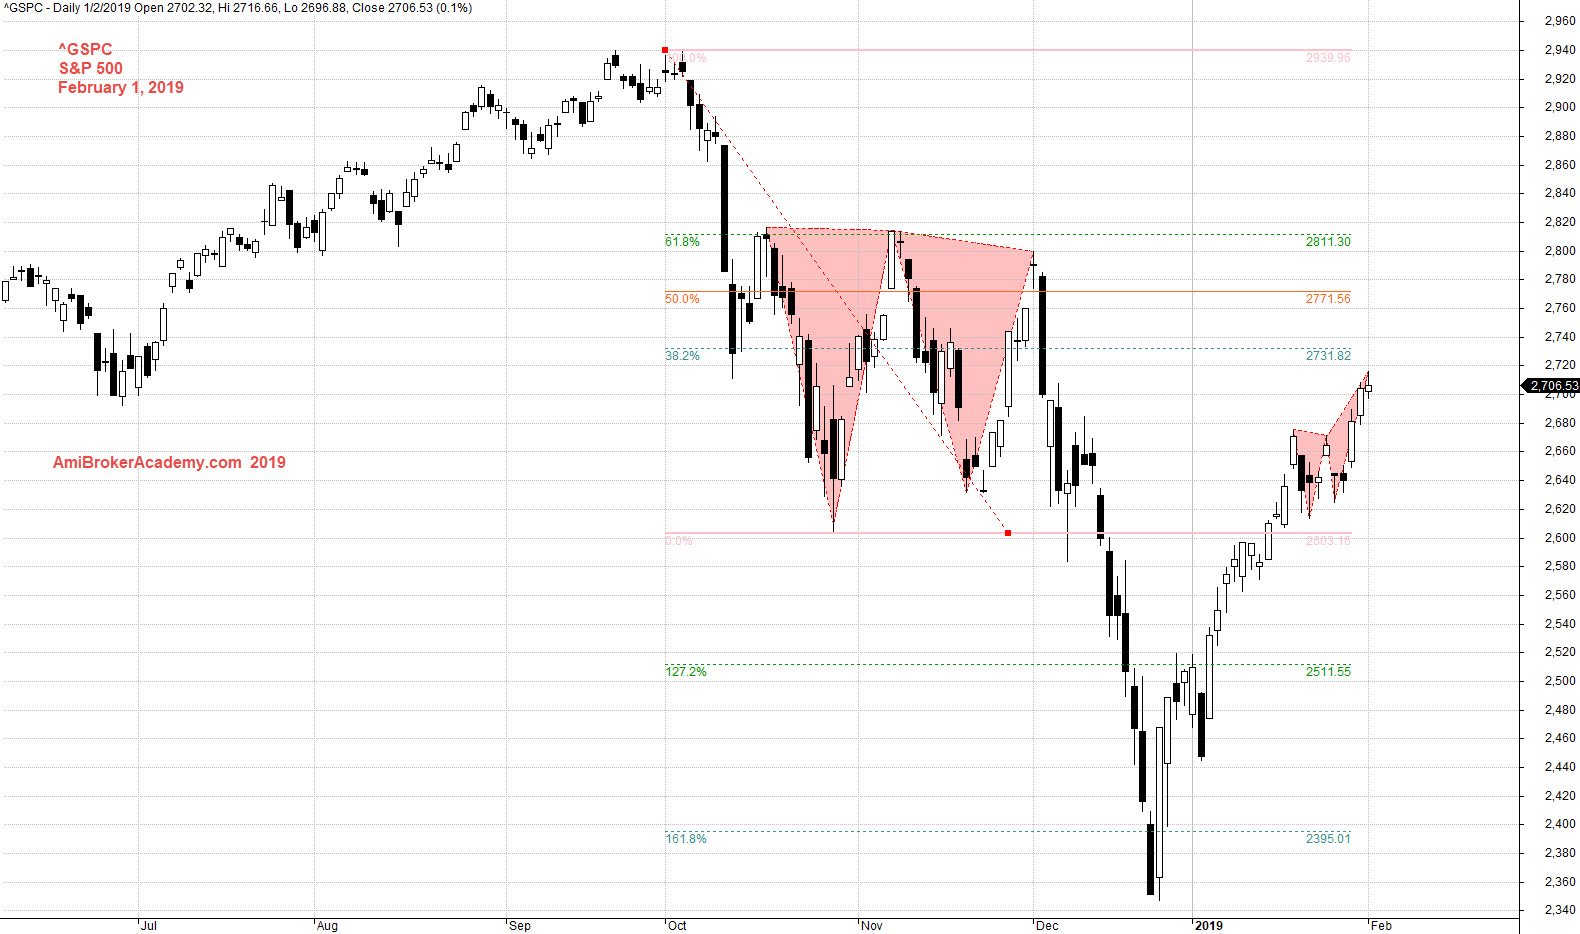
Picture worth a thousand words, see chart.
To aid the understand of price action, swing high to low using Fibonacci extension. Price action close below 161%.
Trade with eyes open.
Swing high to low, Fibonacci retracement the price action pullback to 61%. See chart of Standard and Poors 500 Index Fibonacci retracement.
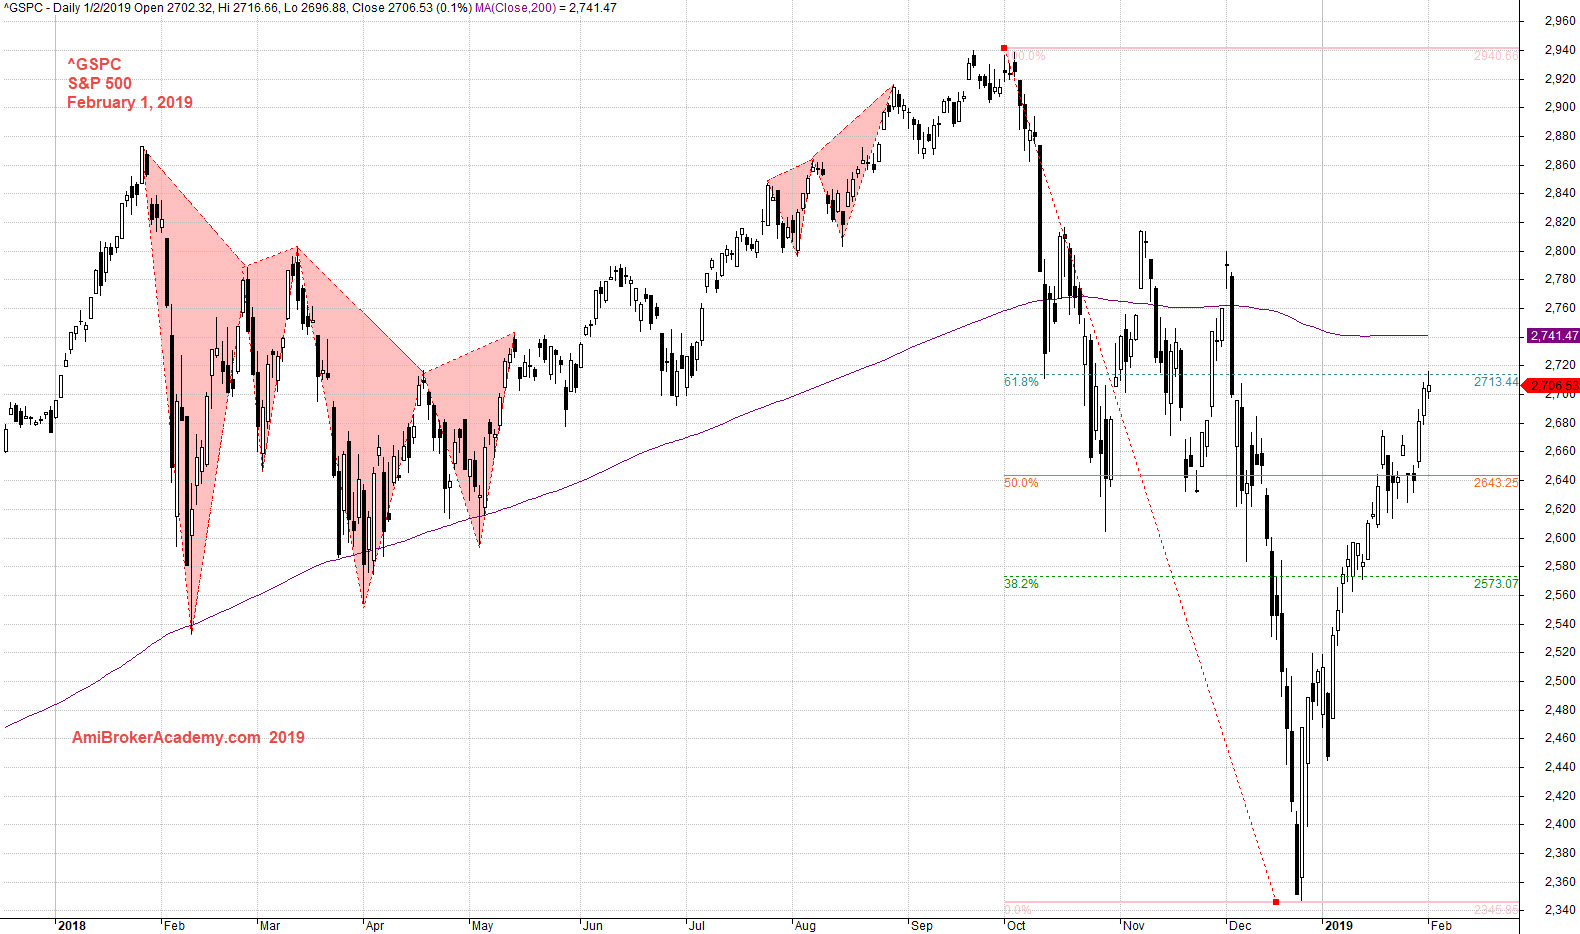
February 1, 2019 Standard and Poors 500 Index and Fibonacci Retracement
Study the chart using MACD indicator. MACD cross down signal fail. See chart.
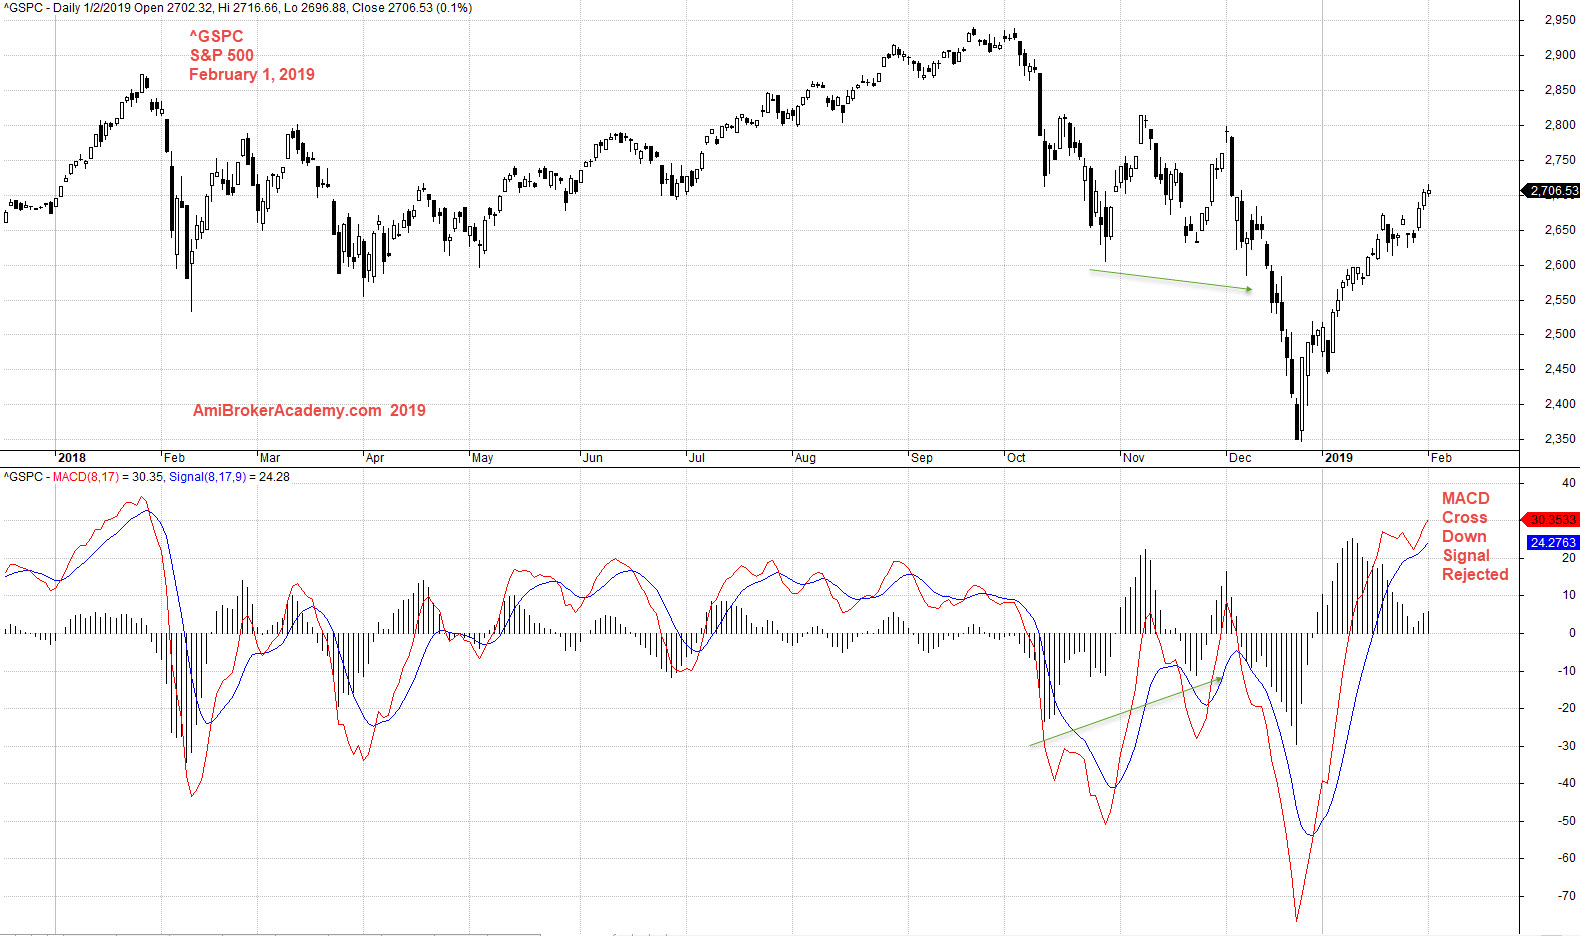
February 1, 2019 Standard and Poors 500 Index and MACD
Moses Stock Analysis
AmiBrokerAcademy.com
Disclaimer
The above result is for illustration purpose. It is not meant to be used for buy or sell decision. We do not recommend any particular stocks. If particular stocks of such are mentioned, they are meant as demonstration of Amibroker as a powerful charting software and MACD. Amibroker can program to scan the stocks for buy and sell signals.
These are script generated signals. Not all scan results are shown here. The MACD signal should use with price action. Users must understand what MACD and price action are all about before using them. If necessary you should attend a course to learn more on Technical Analysis (TA) and Moving Average Convergence Divergence, MACD.
Once again, the website does not guarantee any results or investment return based on the information and instruction you have read here. It should be used as learning aids only and if you decide to trade real money, all trading decision should be your own.